


Bitcoin has climbed above its highest level since June 22, 2026, breaking through the $65,000 mark and gradually reversing the bearish narrative that emerged after its drop below $60,000. In recent weeks, BTC has once again rebounded quickly after briefly falling beneath $60,000, with investors hoping the positive sentiment can become more sustainable as Bitcoin's correlation with equities, the US dollar, and oil continues to decline.
Has Bitcoin Found a Bottom? ETFs Offer the First Positive Signals
After eight consecutive weeks of outflows, US spot Bitcoin ETFs finally returned to positive territory, attracting approximately $197 million in net inflows. Although this amount remains modest compared with the more than $4 billion that left the funds in June, many analysts see it as the first sign that market sentiment may be stabilizing. According to Bloomberg, the market narrative is gradually shifting from "Who is left to sell?" toward "Is selling pressure finally running out?"
- US spot Bitcoin ETFs ended an eight-week streak of outflows, recording approximately $197 million in net inflows.
- June saw record outflows exceeding $4 billion, making the recent inflows more of a stabilization signal than the beginning of a new bull market.
- Despite Bitcoin's decline following higher oil prices and renewed tensions in the Middle East, institutional investors did not immediately rush for the exits.
- According to Glassnode, Bitcoin may be forming a local bottom in the $57,000-$63,000 range, provided no major macroeconomic shock emerges.
- FRNT Financial described the positive ETF flows as the first "green shoots" but cautioned that it is still too early to declare a lasting trend reversal.
- At the same time, the 30-day average daily trading volume of US spot Bitcoin ETFs has fallen 78%, declining from roughly $5.8 billion at the peak in late 2025 to around $1.25 billion today.
- Glassnode believes the drop in trading activity reflects institutional investors shifting their attention toward other asset classes.
The Market Is Still Waiting for Strong Demand to Return
Although selling pressure appears to be easing, analysts emphasize that the market has yet to receive a meaningful demand impulse. Trading volumes remain subdued, while some of Bitcoin's largest structural buyers have reduced their activity. As a result, the current price stabilization may represent only the early stages of a long-term bottoming process.
- On-chain data shows that long-term holders have returned to accumulation, while weaker hands continue realizing losses.
- Glassnode notes that long-term holders are realizing losses at the fastest pace since late 2022, a pattern that has historically coincided with the final stages of bear markets.
- ETF inflows remain far smaller than the capital that exited the funds in recent months, meaning they do not yet confirm a sustained return of institutional demand.
- Strategy (formerly MicroStrategy), one of Bitcoin's largest structural buyers, has recently paused its purchases, increasing the importance of ETF inflows in supporting prices.
- Bloomberg-cited Tagus Capital believes positive ETF flows are helping establish a price floor but do not yet signal the beginning of a new bull market.
- The key challenge for investors now is identifying the signals that confirm the worst phase of the selloff has truly come to an end.
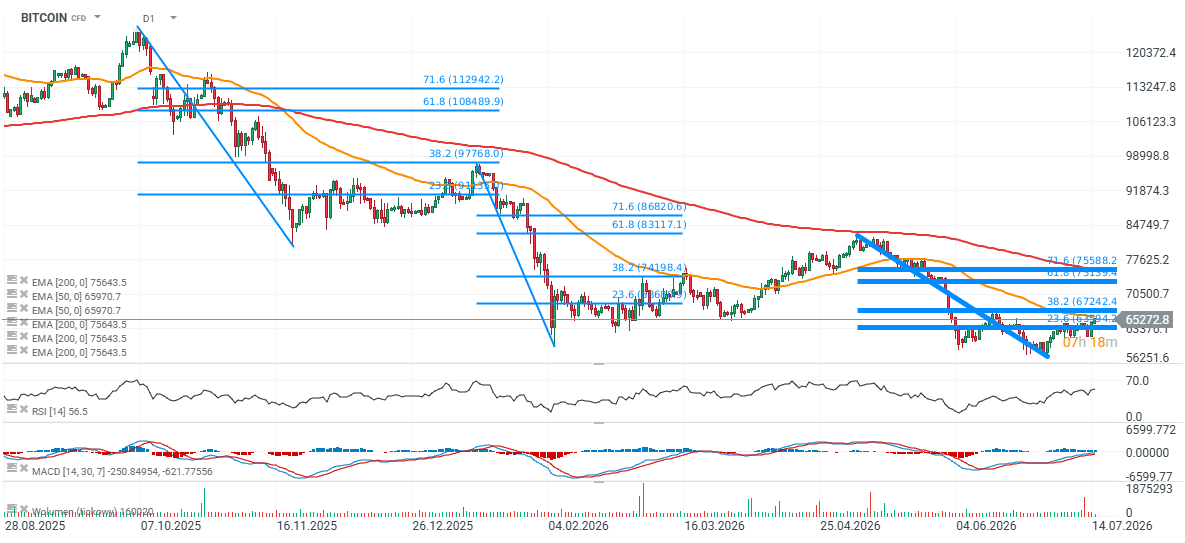
Bitcoin (D1 interval)
Looking at Bitcoin's last two major downside impulses, the price resumed its downtrend in the first quarter after rallying to the 38.2% Fibonacci retracement near $98,000. During the second correction, BTC initially turned lower after reaching the 38.2% Fibonacci level around $74,000 but ultimately advanced to approximately $83,000, corresponding to the 61.8% retracement. If Fibonacci levels continue to shape the current recovery, the next key resistance lies near $67,000, where the 38.2% retracement is located, followed by the 61.8% retracement around $75,500. Both levels are measured from the bearish impulse that began in May this year. On the downside, the $57,000-$60,000 area remains a key support zone, and it is worth noting that Bitcoin has already rebounded twice from levels below this range during 2026.
Source: xStation5



US Diesel Export Ban: Is It a problem for Europe?



Norges Bank raises intrest rates

Chart of the Day: OIL Returns to Gains 🔼 U.S.–Iran Talks Remain Deadlocked (24.09.2026)



Morning Wrap: Equity indices fall as bond yields surge 🚩 Mixed data from Australia (24.09.2026)
The material on this page does not constitute as financial advice and does not take into account your level of understanding, investment objectives, financial situation or any other particular needs.
All the information provided, including opinions, market research, mathematical results and technical analyses published on the website or transmitted to you by other means is provided for information purposes only and should in no event be interpreted as an offer of, or solicitation for, a transaction in any financial instrument, nor should the information provided be construed as advice of legal or fiscal nature.
Any investment decisions you make shall be based exclusively on your level of understanding, investment objectives, financial situation or any other particular needs. Any decision to act on information published on the website or transmitted to you by other means is entirely at your own risk. You are solely responsible for such decisions.
If you are in doubt or are not sure that you understand a particular product, instrument, service, or transaction, you should seek professional or legal advice before trading.
Investing in OTC Derivatives carries a high degree of risk, as they are leveraged based products and often small movements in the market could lead to much larger movements in the value of your investment and this could work against you or for you. Please ensure that you fully understand the risks involved, taking into account your investments objectives and level of experience, before trading, and if necessary, seek independent advice.