
The largest of the cryptocurrencies started the rally as shares of First Republic Bank (FRC.US) slid nearly 50% yesterday following a quarterly report that showed nearly $100 billion in deposit outflows in Q1 2022. Bitcoin surpassed $29,000 and Ethereum is near $1,900. The gains were also helped by better-than-expected results from Alphabet (GOOGL.US) and Microsoft (MSFT.US), which could mean that the technology sector (US100) will do better than companies in the financial sector (US500). Bitcoin's rebound has also pushed up the prices of many altcoins including Cardano, Dogecoin:
- In view of the recent reaction, many analysts in the cryptocurrency sector have indicated that decentralized Bitcoin could be seen as a 'safe haven' asset in an environment of weakness in centralized finance
- Yesterday's reaction of Bitcoin showed that the increases of the second half of March may 'not have been accidental' and BTC is indeed starting to be perceived by the market as a 'hedge' against uncertainty in the banking sector
- According to Standard Chartered analysts, Bitcoin's dominance in the crypto world may be growing putting pressure on altcoin listings. Bitcoin accounts for nearly 45% of the value of the cryptocurrency market. Standard Chartered says it will eventually account for as much as 55-60%
- The bank's analysis also underscored that the 'BTC economy' lacked the necessary 'confidence' for the banking sector, and stress among BTC miners has subsided, in the face of mining costs of $15,000. This took much of the pressure off the cryptocurrency's quotations.
Could bitcoin have formed the bottom of the cycle?
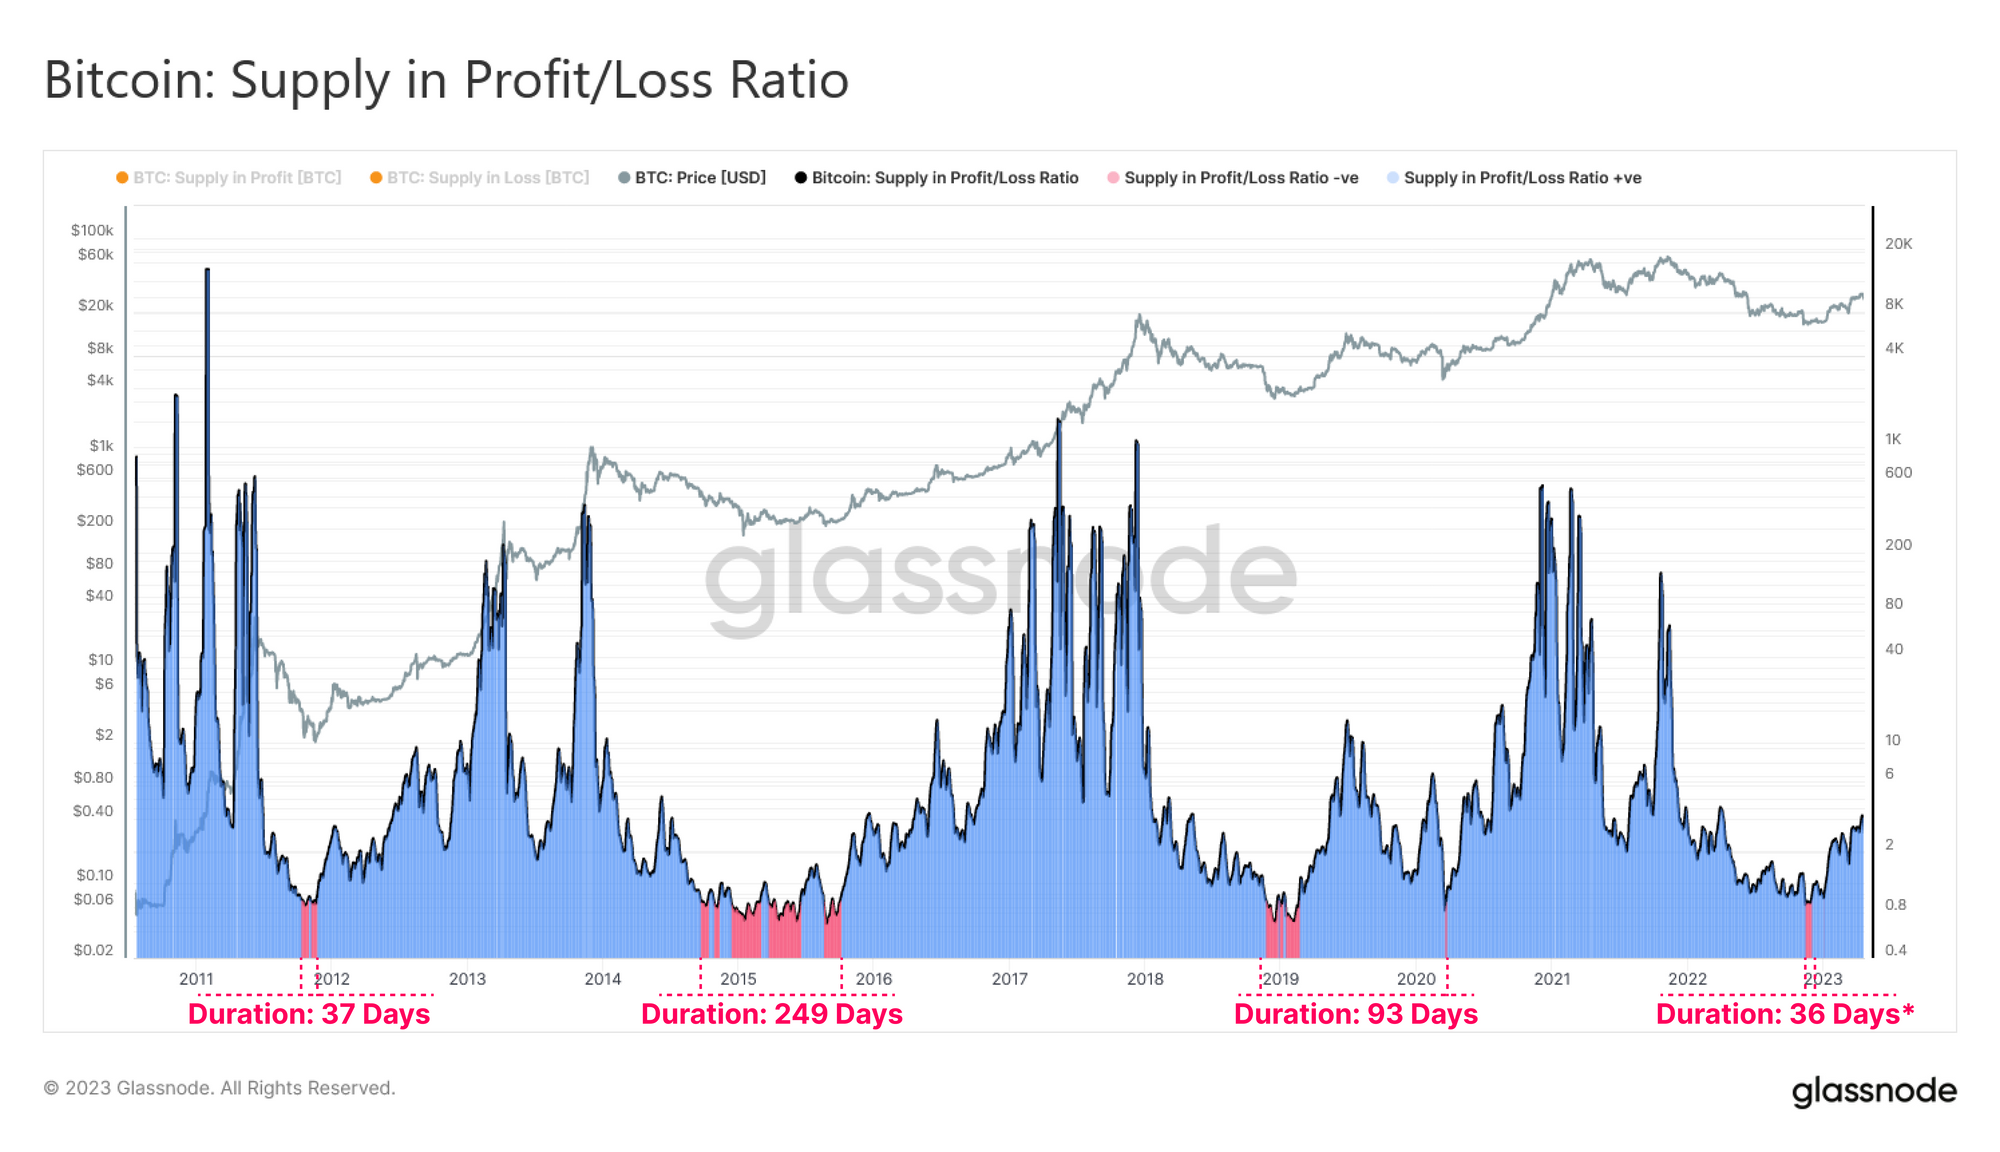 Glassnode measured the ratio between BTC supply in gain and supply in loss. Glassnode's on-chain analysis indicates that the ratio reached a so-called 'escape velocity' coming out of a loss-dominated period (the bottom of the cycle), which historically occurred for 415 out of 4638 total BTC trading days (about 9%). This period in 2022 was the shortest of all previous cycles. Source: Glassnode
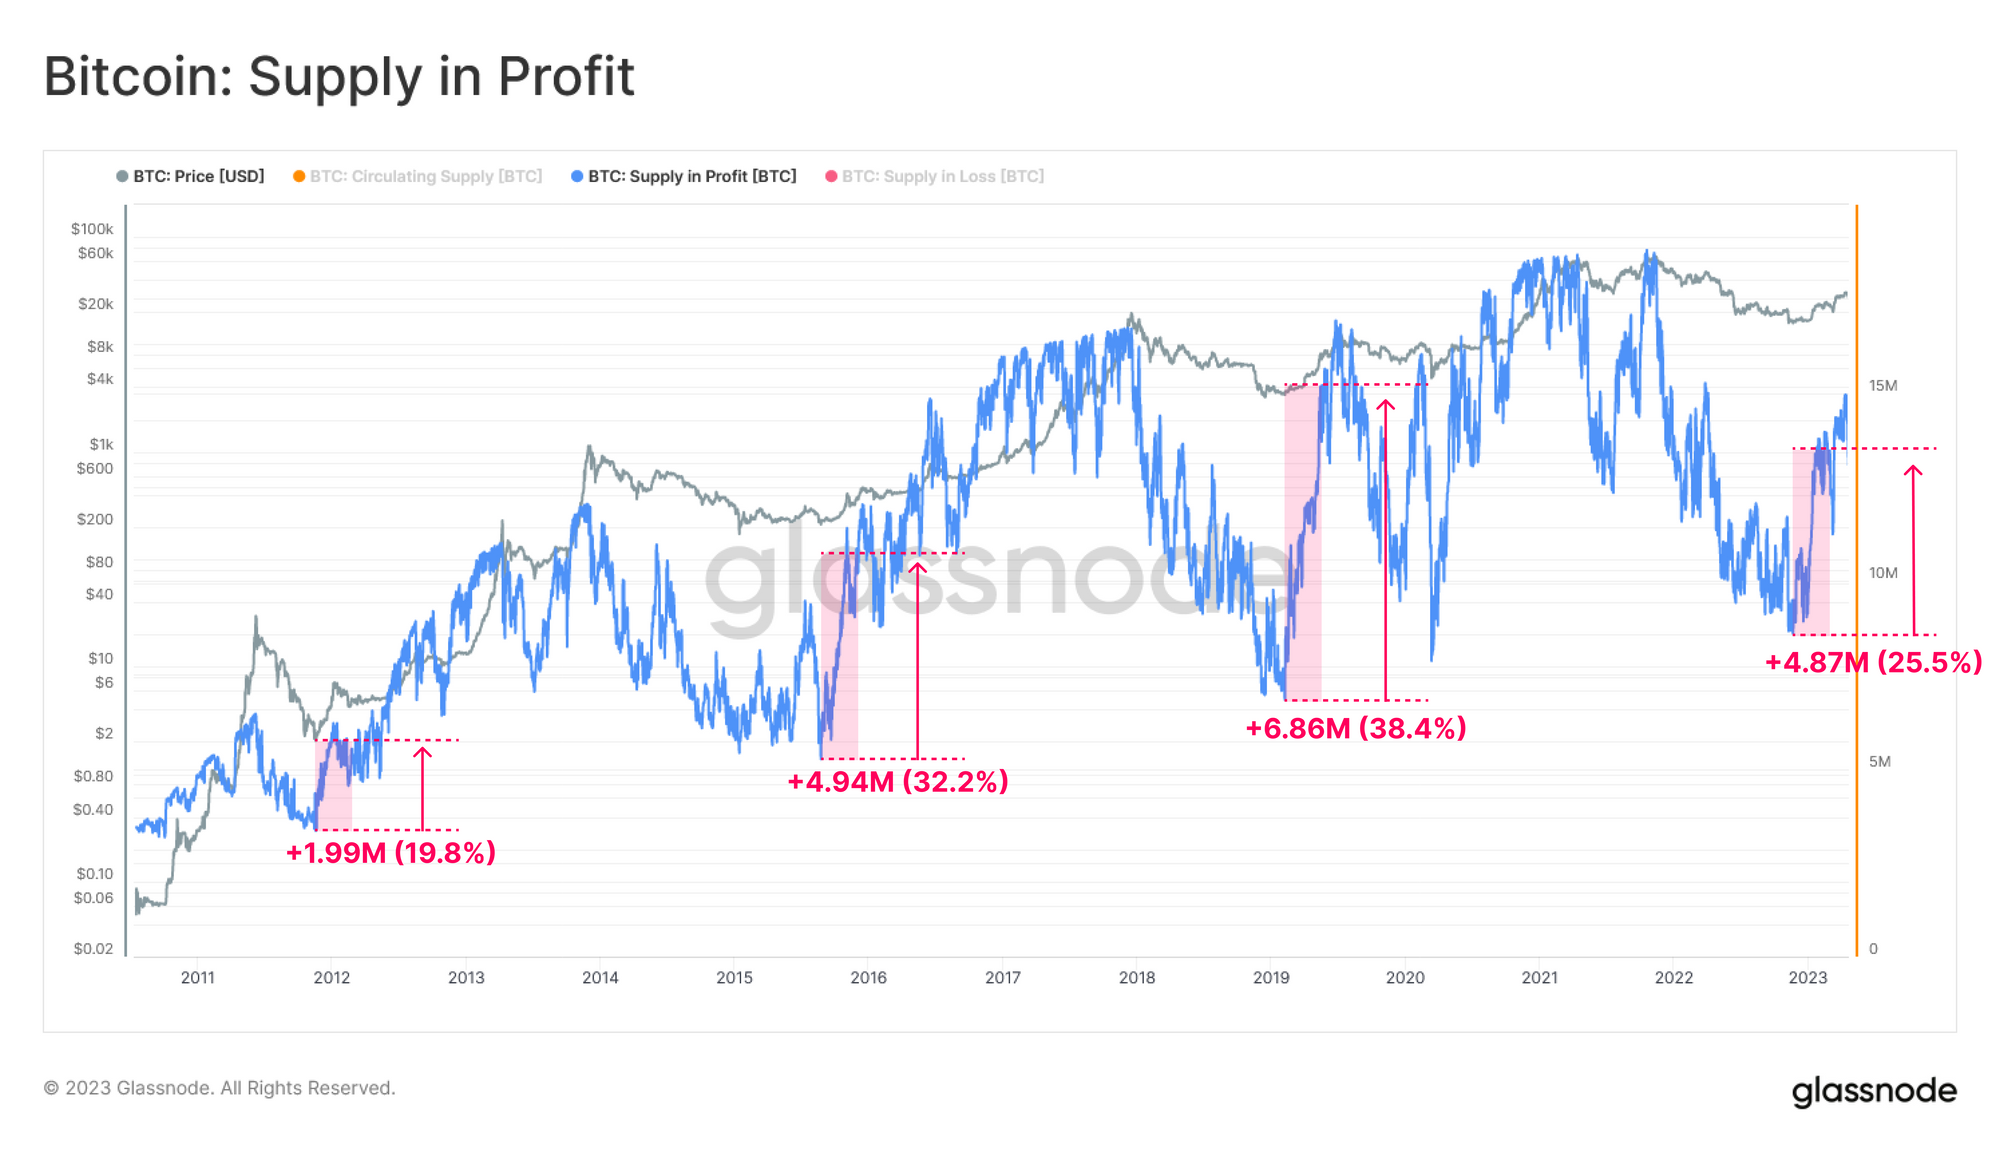 The largest rebounds in unrealized profits occur when the BTC price exceeds key levels for supply (e.g. levels of cycle bottoms). Glassnode attempts to check these levels by analyzing the 100-day change in profitable BTC supply coming out of the bottoms in previous cycles. Showing a rebound in both the amount of 'profitable' BTC and the % share of total supply:
- 2011: +1.99M BTC (19.8%)
- 2015: +4.94m BTC (32.2%)
- 2019: +6.86m BTC (38.4%)
- 2022: +4.87M BTC (25.5%)
The on-chain data indicates that the amount of supply that has surged into unrealized gains in the current cycle is as steep as in previous cycles. This may indicate a solid bottom formed below $20,000.
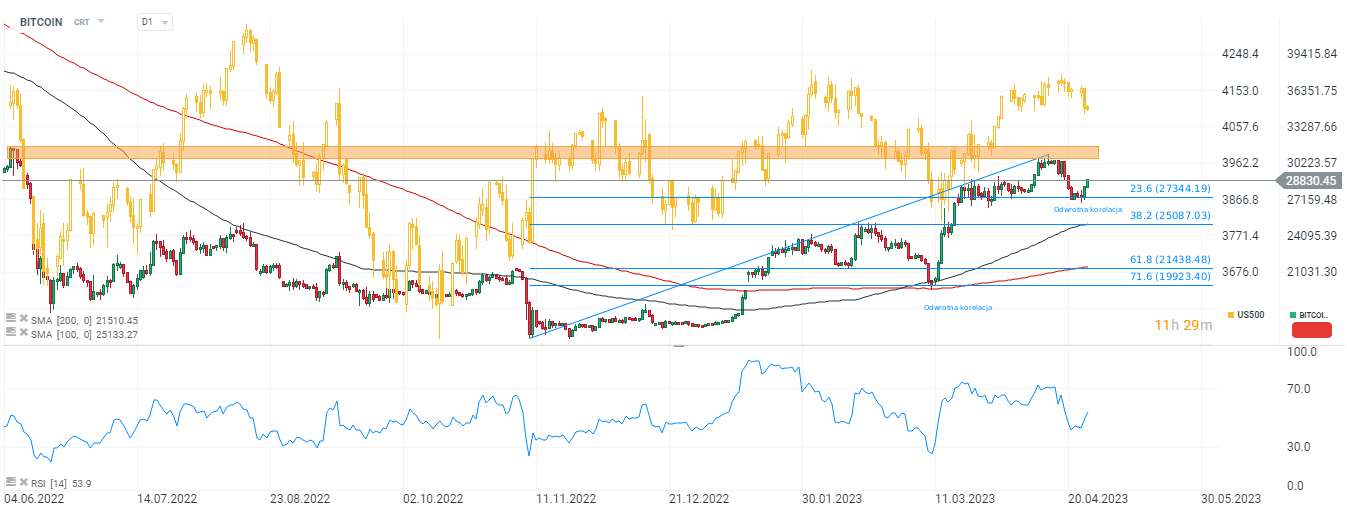 Bitcoin chart, D1 interval and US500 (yellow chart). Bitcoin again showed a negative correlation with the S&P500 and started an upward movement when US500 contracts weakened, influenced by weakness in the banking sector. The RSI indicator is still at relatively neutral levels indicating that the bulls still have plenty of room to possibly continue their attack. The first significant resistance level appears to be around $30,000 - $31,000, last seen in early summer 2022. The bulls has defended the bullish momentum at 23,6 Fibonacci retracement. Source: xStation5

Bitcoin gains 3% ahead of the US PPI data

Morning Wrap: Risk appetite is back despite new exchange of US-Iran strikes (11.06.2026)

Bitcoin Looks Cheap, But Is This the Bottom? Crypto Markets Are Waiting for a Catalyst
BREAKING 🚨 Nasdaq tumbles 2.4%, Bitcoin tests key $60K support
The material on this page does not constitute as financial advice and does not take into account your level of understanding, investment objectives, financial situation or any other particular needs.
All the information provided, including opinions, market research, mathematical results and technical analyses published on the website or transmitted to you by other means is provided for information purposes only and should in no event be interpreted as an offer of, or solicitation for, a transaction in any financial instrument, nor should the information provided be construed as advice of legal or fiscal nature.
Any investment decisions you make shall be based exclusively on your level of understanding, investment objectives, financial situation or any other particular needs. Any decision to act on information published on the website or transmitted to you by other means is entirely at your own risk. You are solely responsible for such decisions.
If you are in doubt or are not sure that you understand a particular product, instrument, service, or transaction, you should seek professional or legal advice before trading.
Investing in OTC Derivatives carries a high degree of risk, as they are leveraged based products and often small movements in the market could lead to much larger movements in the value of your investment and this could work against you or for you. Please ensure that you fully understand the risks involved, taking into account your investments objectives and level of experience, before trading, and if necessary, seek independent advice.