



The weekend brought plenty of encouraging news on the institutional adoption front. Japanese financial giants SBI Securities and Rakuten Securities have announced plans to launch their own Bitcoin- and Ethereum-based trust funds, which could open the door to digital assets for millions of retail investors there. Furthermore, the CME Group has announced the launch of new Nasdaq CME Crypto Index futures contracts in June.
The reality reflected in the charts can, however, be brutal, and in the short term, the market was dominated by entirely different sentiments. Monday morning saw a sharp sell-off across the broader cryptocurrency market, driven by a sudden resurgence of risk aversion. Donald Trump once again stoked geopolitical tensions by warning Iran that “time is running out” to reach a deal, which immediately hit the stock markets and dragged Bitcoin down with them as a barometer of global liquidity. As a result, the price retreated to levels not seen for several weeks, leaving buyers with their backs against the wall.
Technical Analysis (D1 timeframe)
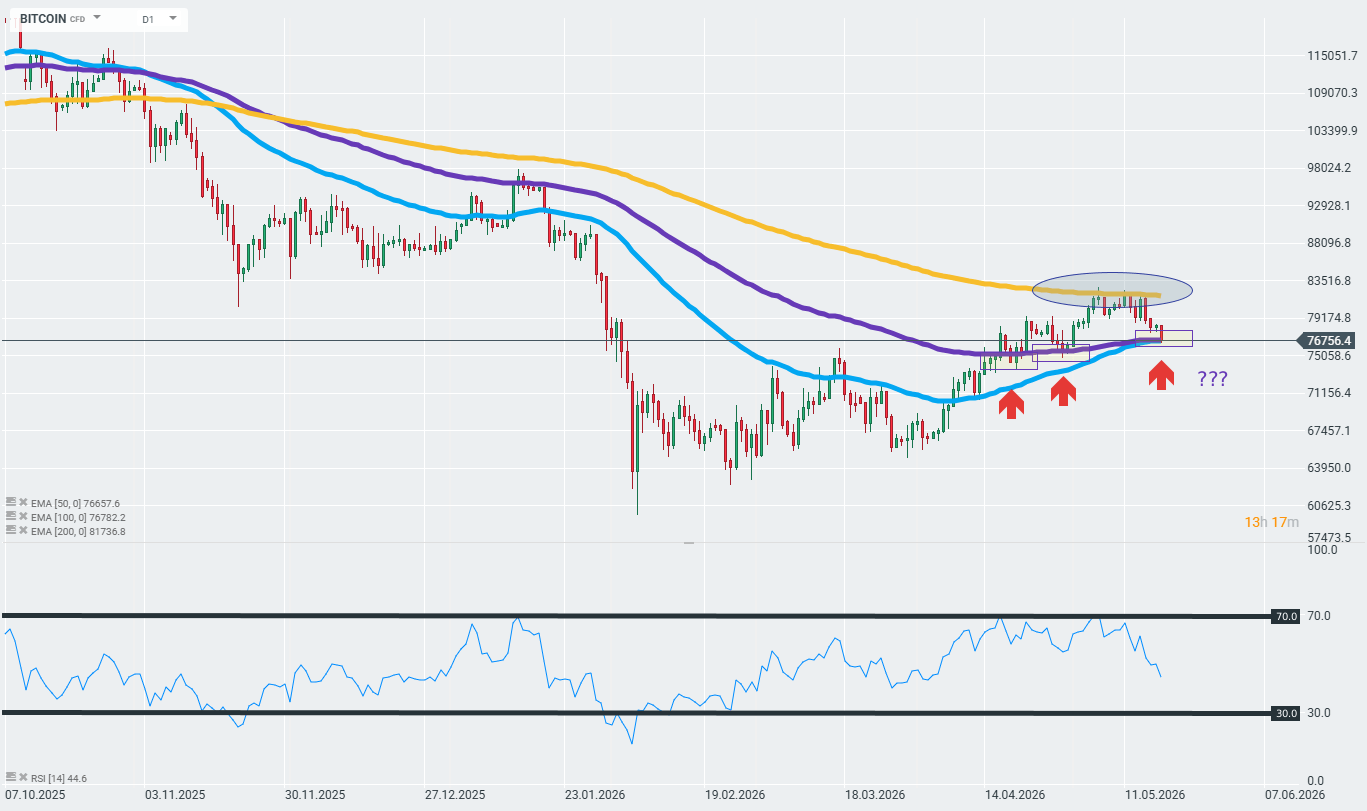
The current correction has brought Bitcoin’s price directly to a key support level around $76,756, where the fate of medium-term sentiment hangs in the balance. It is here that a strong support cluster runs, formed by the converging moving averages EMA 50 and EMA 100, which in recent weeks have repeatedly served as an effective springboard for a rebound for the bulls. However, an earlier attempt at a more sustained reversal of the downtrend was precisely halted by resistance at the EMA 200 (approx. $81,736), confirming that the supply side remains strong. The situation is exacerbated by the RSI indicator, which, after falling to 44.6 points, reflects a loss of momentum among buyers and leaves room for the bears to apply further pressure. In this scenario, a sustained break below the current support level by the daily candle body could pave the way for a deeper sell-off towards $71,150, whilst holding this level could signal the potential for a higher low and a renewed attempt to reach local highs. Source: xStation



3 markets to watch next week (25.09.2026)


Oil slides 3.5% 📉 Iran emphasizes its strong position in negotiations with the U.S.


🚩 TNOTE falls to its lowest level since 2007


Crypto News 📉 Bitcoin pulls back after reaching its highest levels since January. What’s next?
The material on this page does not constitute as financial advice and does not take into account your level of understanding, investment objectives, financial situation or any other particular needs.
All the information provided, including opinions, market research, mathematical results and technical analyses published on the website or transmitted to you by other means is provided for information purposes only and should in no event be interpreted as an offer of, or solicitation for, a transaction in any financial instrument, nor should the information provided be construed as advice of legal or fiscal nature.
Any investment decisions you make shall be based exclusively on your level of understanding, investment objectives, financial situation or any other particular needs. Any decision to act on information published on the website or transmitted to you by other means is entirely at your own risk. You are solely responsible for such decisions.
If you are in doubt or are not sure that you understand a particular product, instrument, service, or transaction, you should seek professional or legal advice before trading.
Investing in OTC Derivatives carries a high degree of risk, as they are leveraged based products and often small movements in the market could lead to much larger movements in the value of your investment and this could work against you or for you. Please ensure that you fully understand the risks involved, taking into account your investments objectives and level of experience, before trading, and if necessary, seek independent advice.