


Following Monday's improvement in market sentiment, which brought a substantial decline in energy commodity prices, we are observing a partial reversal driven by reports of a strike by US forces on facilities located in southern Iran, likely near Bandar Abbas. WTI crude oil is up by approximately 1.4% in morning trading.
Negotiations between the US and Iran are expected to continue, which is limiting the scale of the declines. The parties are reportedly focusing solely on the "appropriate language" to be used in the final agreement between Washington and Tehran.
Investors are eagerly awaiting further information that could confirm or refute the thesis that the negotiating gaps between the parties are narrowing. At this moment, we are only receiving signals regarding the continued shelling of Lebanon by Israel, which certainly does not fill the markets with optimism.
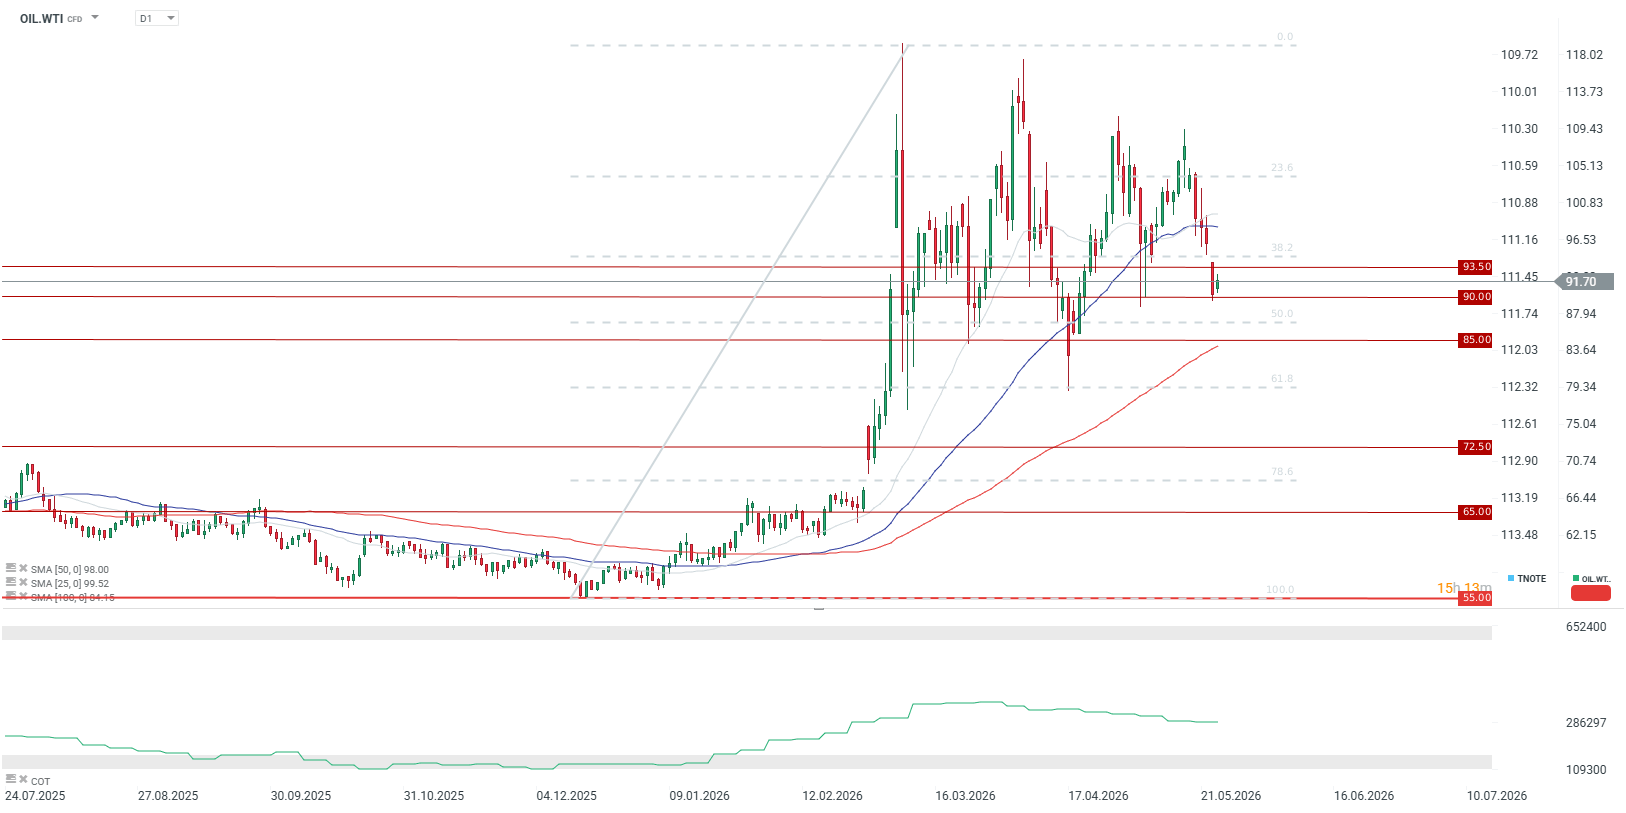
Chart 1: OIL.WTI (24.07.2024 - 25.05.2026)
Source: xStation, 25.05.2026
Currently, the market is in a deeper correction phase after reaching local highs. Recent candlesticks indicate selling pressure. $90 serves as both the nearest support level and a key psychological barrier. Defending it is crucial for the bulls. The next key support level is located at $85. Dynamic resistance is currently provided by the descending blue moving average (SMA 50).
- Fibonacci retracements: A drop below 38.2% and a daily candle close below this mark is a classic technical signal suggesting further declines towards the 50% retracement (which coincides with the aforementioned support at $85).
- Moving Averages: The price has fallen below the shorter-term averages (including the blue SMA 50), confirming a short-term shift to bearish sentiment. The long-term average (the red SMA 100 line) is still sloping upwards and sits below the current price, confirming that in the long-term horizon, the uptrend has not yet been negated.


BREAKING: USD dips after miss in US retail sales data 💥



Market Wrap: European software stocks keep indices near record highs. Dollar gives up this week's gains (14.08.2026)

Chart of the Day 🚩 Speculations Around Faster Rate Hikes in Japan — Could USDJPY Reverse Its Trend?

Economic Calendar 🗽 U.S. Retail Sales and UoM Data in Focus
The material on this page does not constitute as financial advice and does not take into account your level of understanding, investment objectives, financial situation or any other particular needs.
All the information provided, including opinions, market research, mathematical results and technical analyses published on the website or transmitted to you by other means is provided for information purposes only and should in no event be interpreted as an offer of, or solicitation for, a transaction in any financial instrument, nor should the information provided be construed as advice of legal or fiscal nature.
Any investment decisions you make shall be based exclusively on your level of understanding, investment objectives, financial situation or any other particular needs. Any decision to act on information published on the website or transmitted to you by other means is entirely at your own risk. You are solely responsible for such decisions.
If you are in doubt or are not sure that you understand a particular product, instrument, service, or transaction, you should seek professional or legal advice before trading.
Investing in OTC Derivatives carries a high degree of risk, as they are leveraged based products and often small movements in the market could lead to much larger movements in the value of your investment and this could work against you or for you. Please ensure that you fully understand the risks involved, taking into account your investments objectives and level of experience, before trading, and if necessary, seek independent advice.
