
Cryptocurrencies started Monday’s session with declines, and during the night Bitcoin briefly fell toward $92,500, erasing its year-to-date gains; Ethereum dropped back below $3,000. The sell-off was partially reversed as sentiment improved in U.S. futures trading, and the Asian session did not bring further heavy selling. According to CoinGlass, over the past 24 hours the crypto market saw another wave of liquidations totaling more than $620 million, with nearly 70% coming from long positions in BTC and ETH. The pressure is coming largely from rising US spot ETFs net outflows and so-called 4-year cycle, which may suggest that $126k level was the Bitcoin peak during this bull market. On Thursday 13.11.2025, US ETFs saw almost $870 million in outflows (total), which is the second-largest level on record.
- Bitcoin’s decline resembles the previous two corrections seen during the current bull market (as visible on the chart). What worries investors is that these “sharp sell-offs” are not accompanied by strong, broad-market accumulation — undermining the popular “buy the dip” narrative.
- Meanwhile, ETF flows are adding pressure: funds have been selling more BTC during the drop and doing so more consistently, which damages short-term sentiment and raises doubts about institutional appetite going forward.
- Data from crypto options and futures markets indicate cooling speculative activity. On-chain metrics tracked by CryptoQuant and Glassnode point to muted demand and a lack of meaningful bullish catalysts.
- Michael Saylor, CEO of Strategy, confirmed on Friday that the company — which holds more than 640,000 BTC — made additional Bitcoin purchases, expected to be disclosed today. He denied rumors of selling more than 40,000 BTC.
ETFs Are Selling BTC
U.S. Bitcoin ETFs recorded more than $1 billion in net outflows on Thursday and Friday, with BlackRock’s IBIT — previously one of the most aggressive Bitcoin accumulators — acting as the main seller. The market is increasingly concerned, as ETF behavior is viewed as a key driver of the broader crypto trend. Despite the steep drop from the highs, funds are not “buying the dip”; instead of accumulating, they are selling.
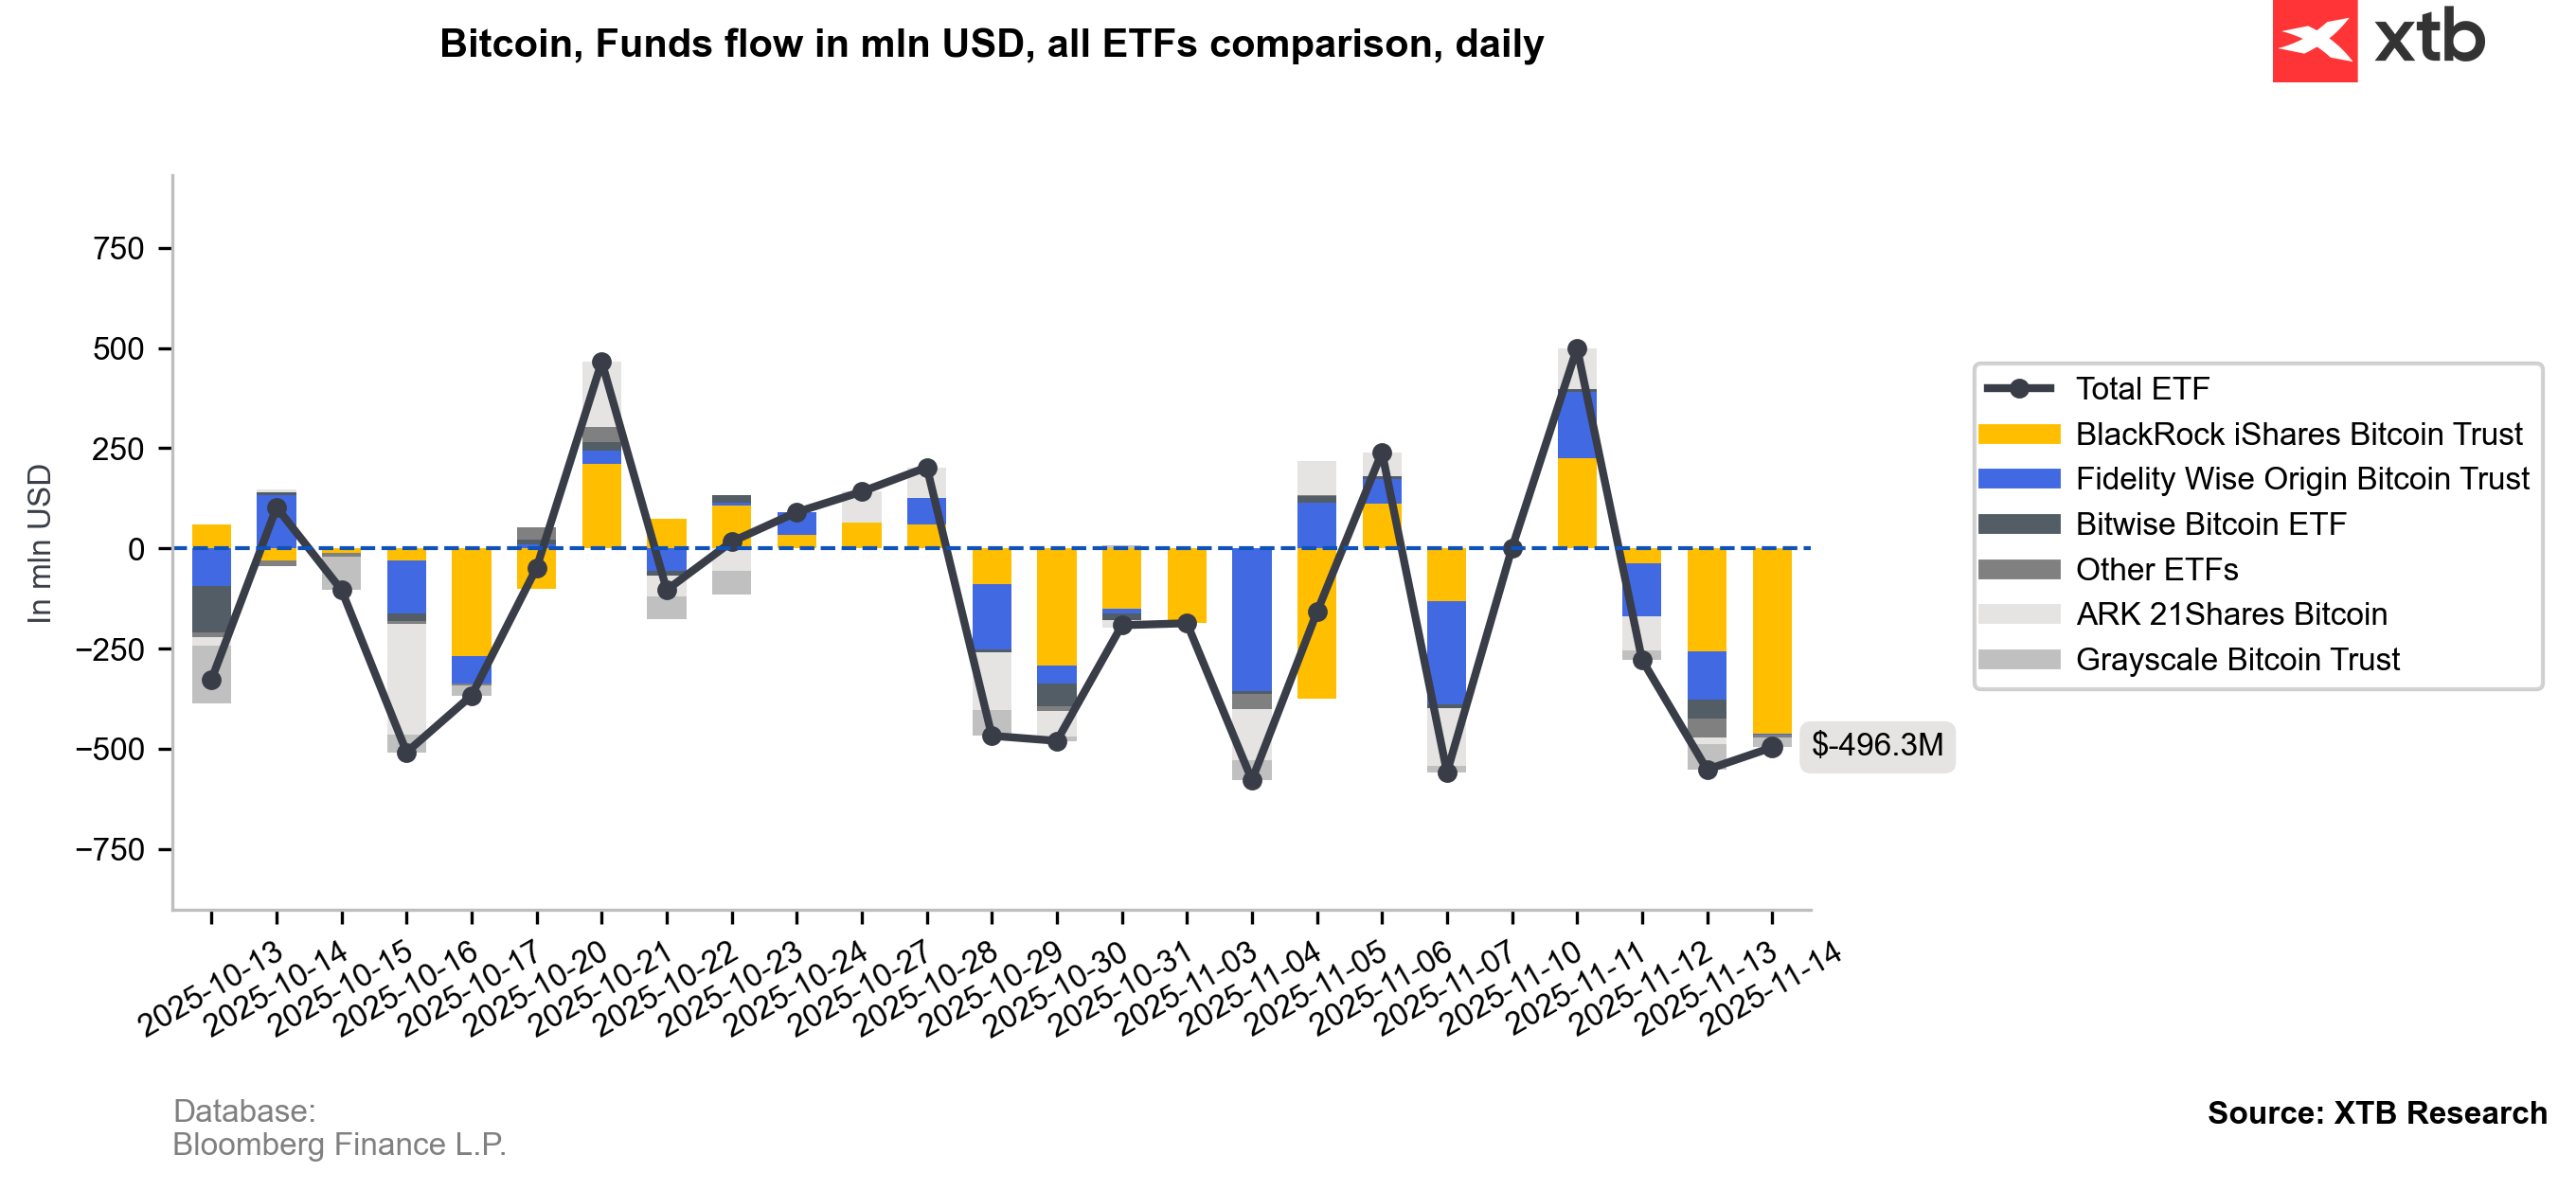
Source: XTB Research, Bloomberg Finance L.P.
For Ethereum, ETF outflows have become almost a daily occurrence since late October, and the sell-off on Wall Street has only reinforced the trend. This dynamic undermines not only expectations for future ETF behavior, but also the narrative surrounding the “second phase” of the bull market — a period in which Ethereum has historically outperformed Bitcoin.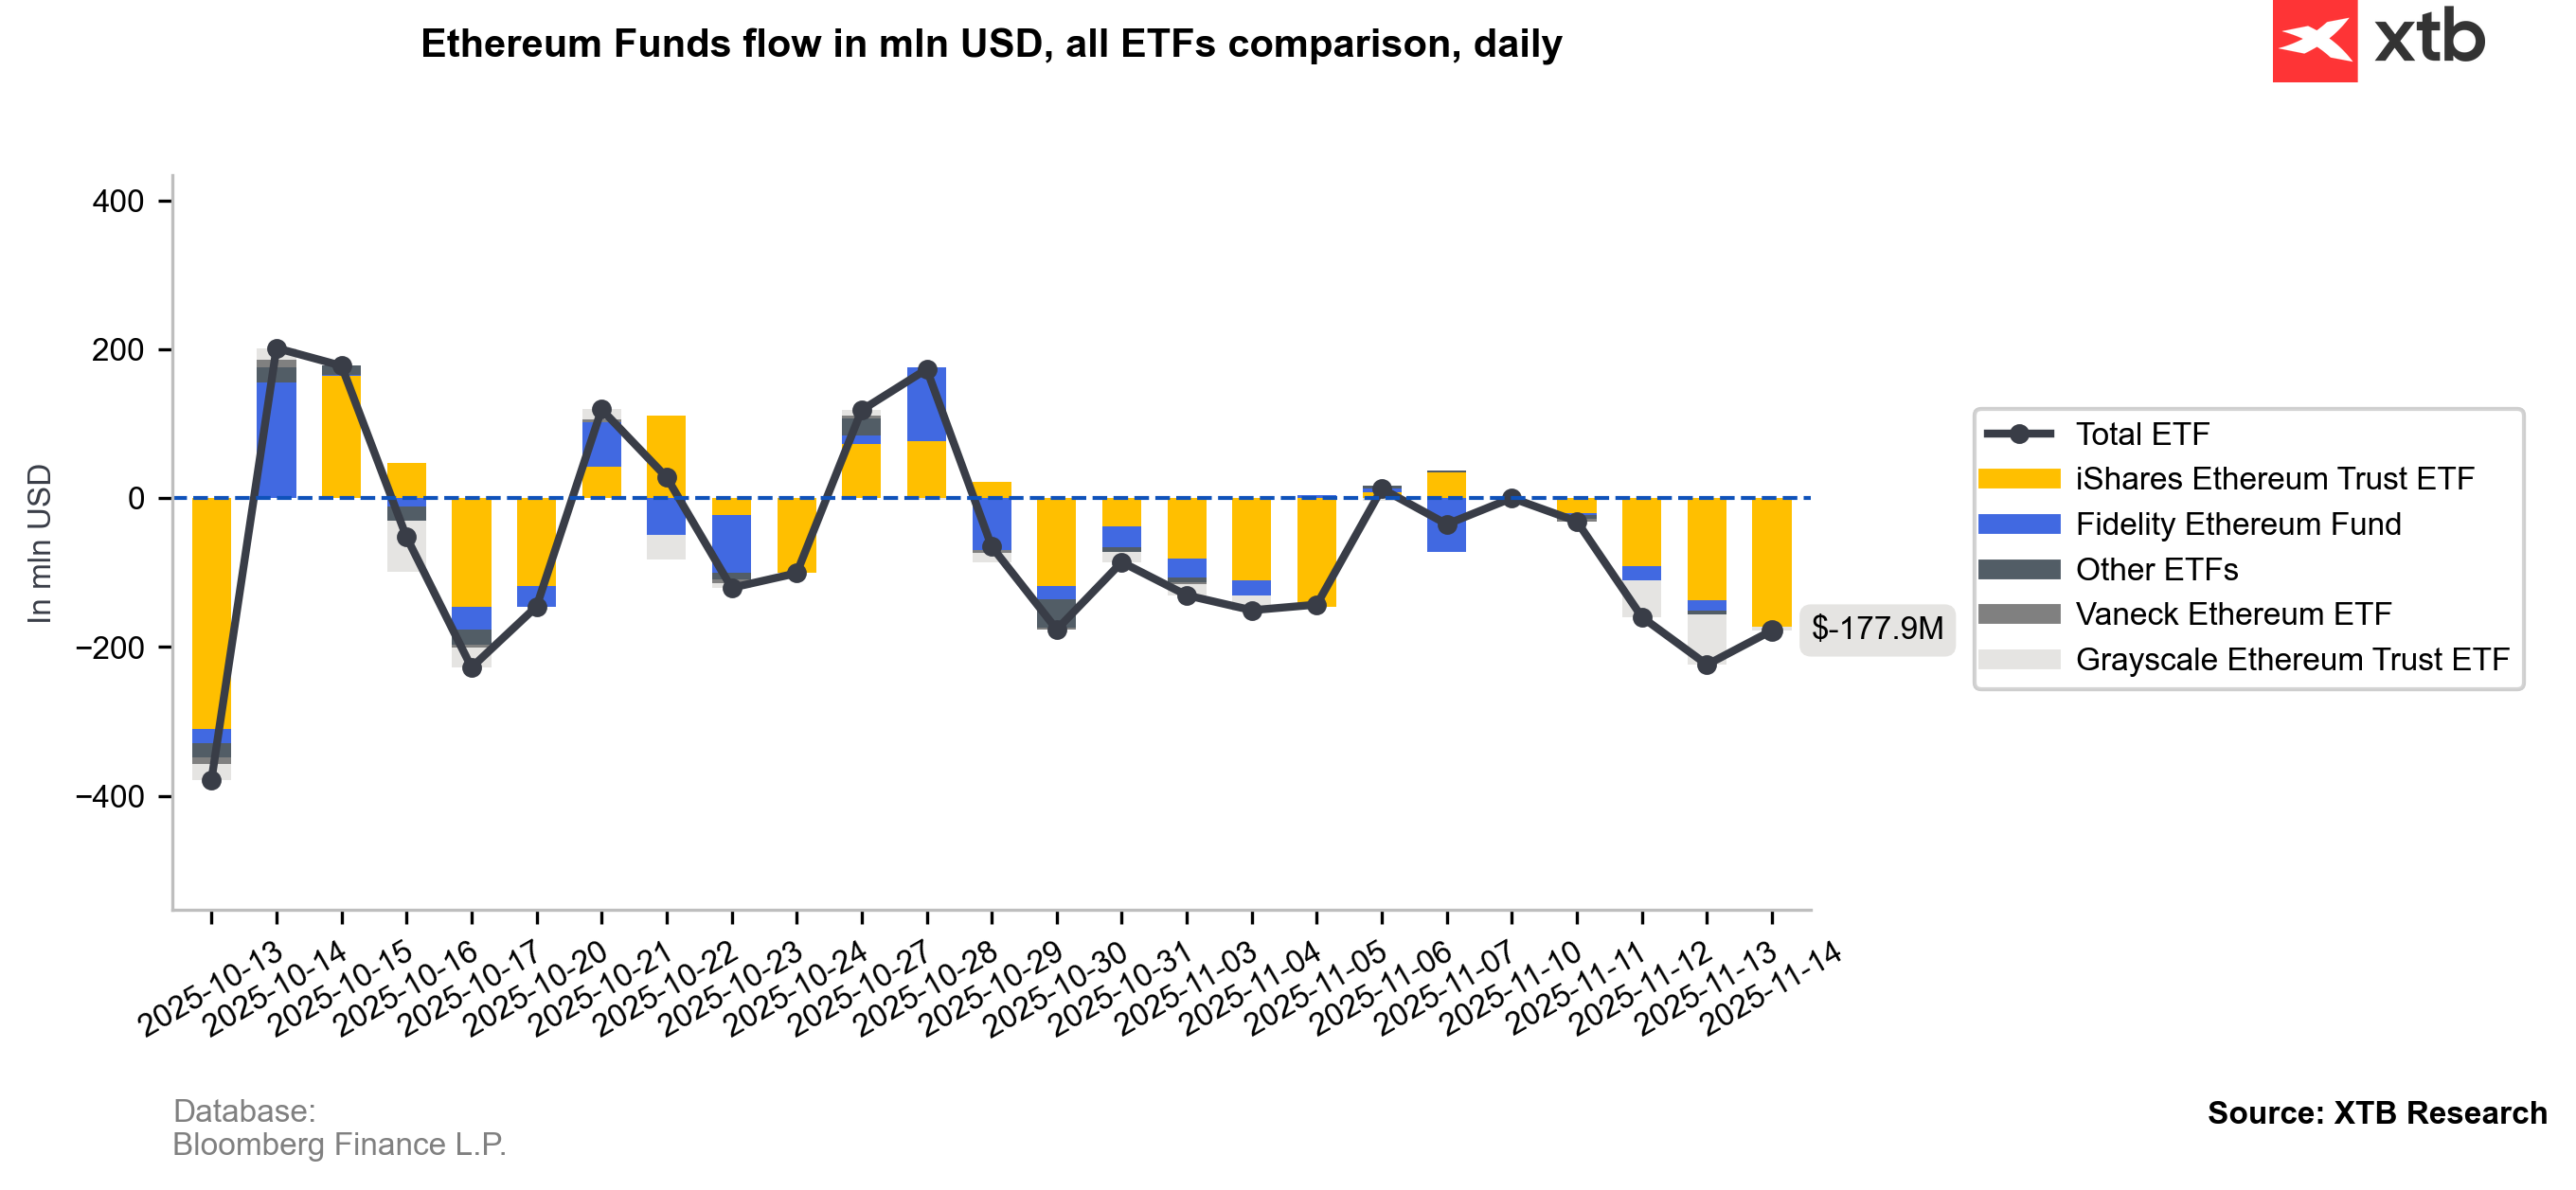
Source: XTB Research, Bloomberg Finance L.P.
Bitcoin and Ethereum Charts (Daily Interval)
Bitcoin remains within its long-term upward channel, but the absence of short-term fundamental catalysts — especially positive ETF flows — has led to a clear erosion of market sentiment. The price is trading about 15% below the 200-day EMA, sitting in the lower part of the channel. A break below $90,000 could signal a more durable trend reversal.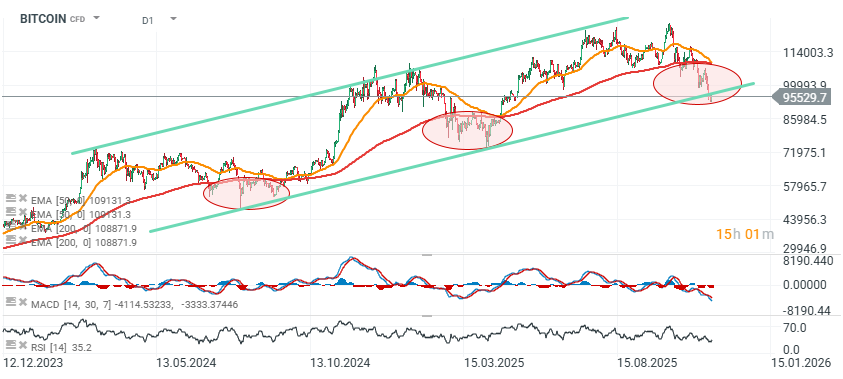
Source: xStation5
Ethereum has fallen nearly 40% from its all-time highs, with the distance from the 200-day EMA similar to Bitcoin — around 15%. The key level to reclaim is now roughly $3,600; a drop below $3,000 could trigger a cascade sell-off toward the $2,700 zone, where previous price reactions occurred.
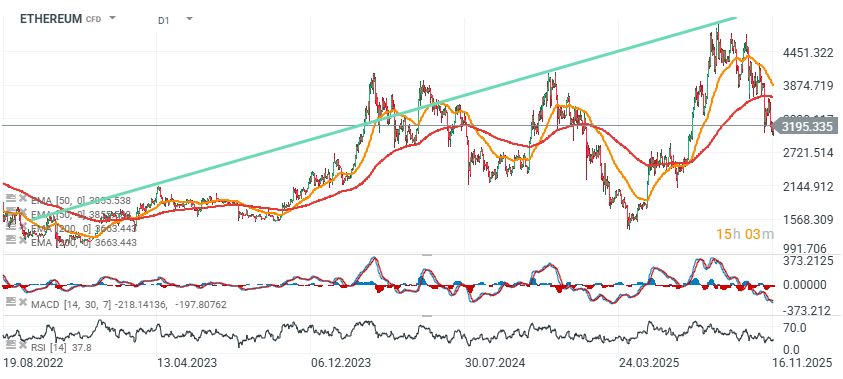
Source: xStation5

Daily summary: Wall Street climbs higher as oil falls 📈 SpaceX surges 28%

Oil slides 2.5% to $88 as Middle East tensions ease 📉 Is the uptrend over?

Wall Street Rebounds as Oil Prices Fall 📈 Adobe Shares Drop 8% After Earnings

BREAKING: USDIDX decline despite strong University of Michigan data
The material on this page does not constitute as financial advice and does not take into account your level of understanding, investment objectives, financial situation or any other particular needs.
All the information provided, including opinions, market research, mathematical results and technical analyses published on the website or transmitted to you by other means is provided for information purposes only and should in no event be interpreted as an offer of, or solicitation for, a transaction in any financial instrument, nor should the information provided be construed as advice of legal or fiscal nature.
Any investment decisions you make shall be based exclusively on your level of understanding, investment objectives, financial situation or any other particular needs. Any decision to act on information published on the website or transmitted to you by other means is entirely at your own risk. You are solely responsible for such decisions.
If you are in doubt or are not sure that you understand a particular product, instrument, service, or transaction, you should seek professional or legal advice before trading.
Investing in OTC Derivatives carries a high degree of risk, as they are leveraged based products and often small movements in the market could lead to much larger movements in the value of your investment and this could work against you or for you. Please ensure that you fully understand the risks involved, taking into account your investments objectives and level of experience, before trading, and if necessary, seek independent advice.