
The gold chart on the hourly timeframe (H1) shows choppy price action over the past weeks, with notable interaction around key technical levels, especially Fibonacci retracements and moving averages.
Since reaching the recent peak at $3,438 (Fibonacci 100% level), the price entered a corrective downward wave, finding initial support at $3,333 (Fibonacci 38.2%), before briefly breaking below to the $3,309 area (Fibonacci 23.6%).
However, in recent sessions, the market experienced a technical rebound from the $3,333 support zone, with the price reclaiming the $3,353 level (Fibonacci 50%) and currently trading around $3,360, slightly above key moving averages.
This setup suggests an attempt for a steady upward breakout, especially if the price manages to hold above the $3,373 level (Fibonacci 61.8%). Continued trading below this barrier would keep the risk of retesting $3,333 or even $3,309 alive.
The Relative Strength Index (RSI) stands at 56, indicating moderate momentum and no overbought conditions, leaving room for further gains without saturation risk.
Technically, gold is showing early signs of stabilization and a rebound from an important support level, but confirmation of a sustained upward trend requires a clear breakout above $3,373. If achieved, the next resistance levels are $3,402 (78.6%) and then the previous high at $3,438.
On the other hand, failure to hold above the $3,350–$3,370 range could lead the market to retest support levels near $3,333 and $3,309.
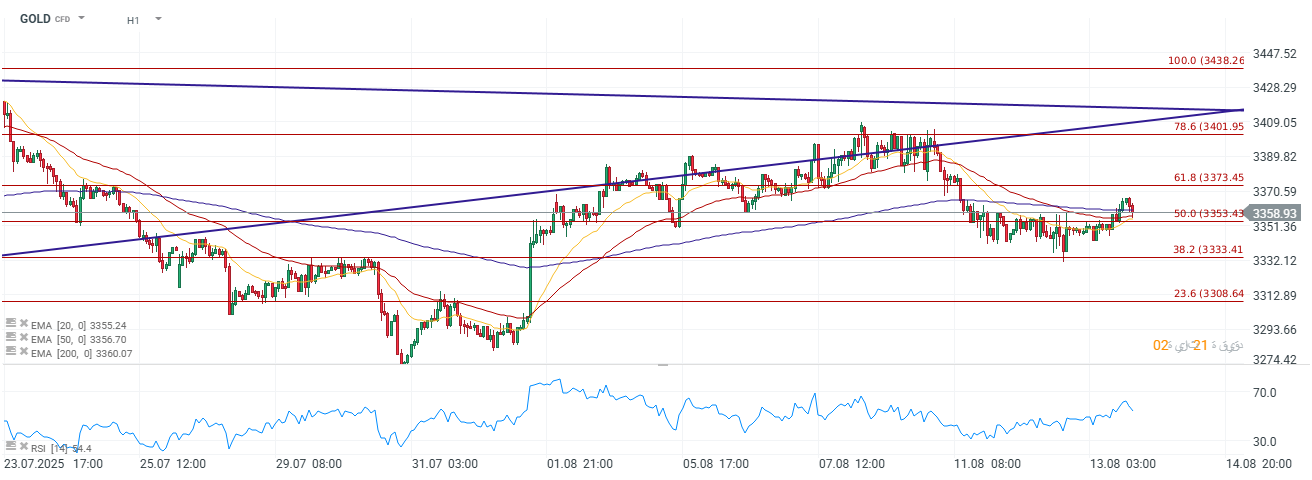
Source: Xstation

Daily Summary: Trump's War Threats Weigh on Markets. Wall Street Sinks into the Red
Tensions around Iran weigh on markets!
US Open: Alphabet and Tesla Weigh on Wall Street, While Oil Prices Renew Investor Concerns

Wheat climbs to the highest level since May 2024 🚜 Black Sea export risks fuel rally
The material on this page does not constitute as financial advice and does not take into account your level of understanding, investment objectives, financial situation or any other particular needs.
All the information provided, including opinions, market research, mathematical results and technical analyses published on the website or transmitted to you by other means is provided for information purposes only and should in no event be interpreted as an offer of, or solicitation for, a transaction in any financial instrument, nor should the information provided be construed as advice of legal or fiscal nature.
Any investment decisions you make shall be based exclusively on your level of understanding, investment objectives, financial situation or any other particular needs. Any decision to act on information published on the website or transmitted to you by other means is entirely at your own risk. You are solely responsible for such decisions.
If you are in doubt or are not sure that you understand a particular product, instrument, service, or transaction, you should seek professional or legal advice before trading.
Investing in OTC Derivatives carries a high degree of risk, as they are leveraged based products and often small movements in the market could lead to much larger movements in the value of your investment and this could work against you or for you. Please ensure that you fully understand the risks involved, taking into account your investments objectives and level of experience, before trading, and if necessary, seek independent advice.