
Goldman Sachs (GS.US) kicked off earnings season by joining other major banks in reporting their Q2 2025 results. Similar to other large U.S. banks with a significant investment banking presence, Goldman Sachs reported strong revenues, driven by a rebound in financial markets after April's sell-offs.
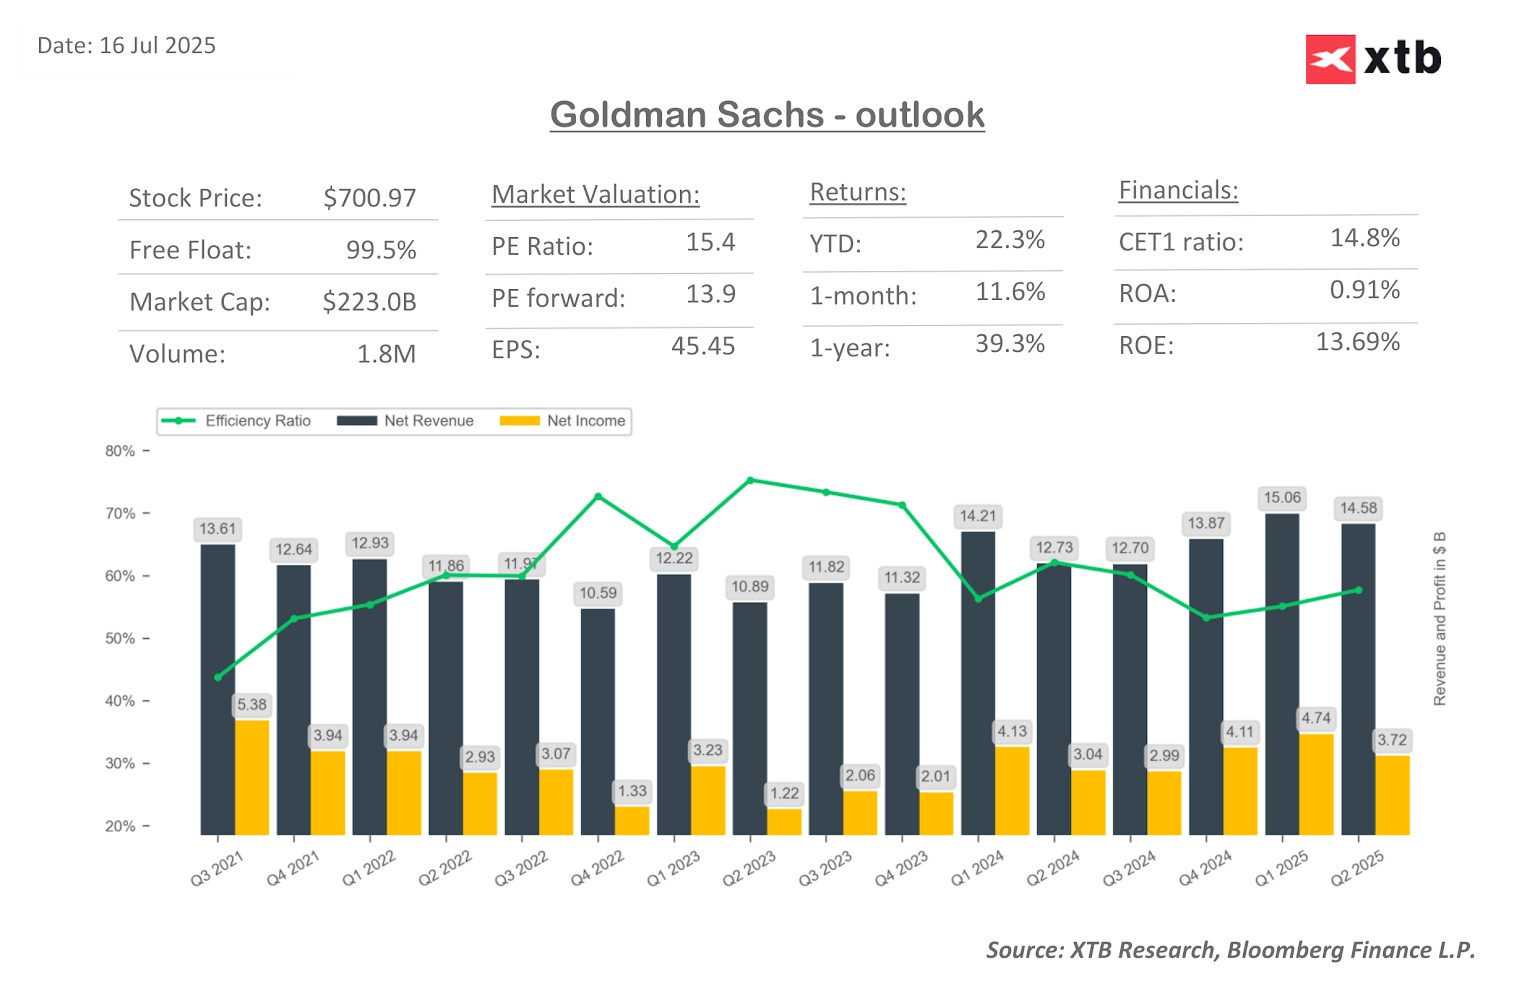
The company reported net revenues of $14.58 billion, a 15% increase year-over-year. Although this figure is lower than the previous quarter, it significantly surpassed estimates of $13.53 billion. The equities trading revenue segment showed the strongest momentum, rising by 23% year-over-year to $4.3 billion. This marks the best result in the company's history for this segment, largely driven by a 45% year-over-year increase in brokerage revenues.
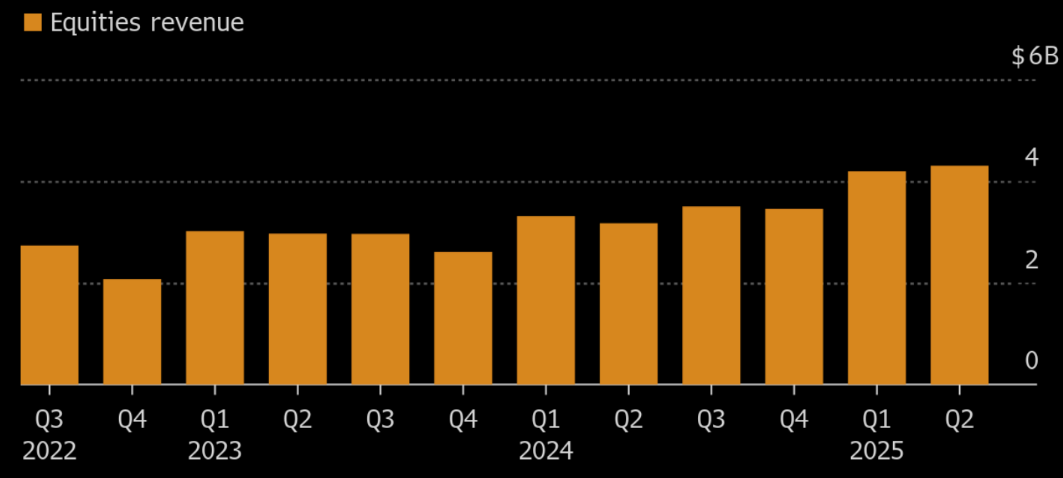
Goldman Sachs' equities trading revenue. Source: Bloomberg Finance L.P.
The company also achieved better-than-expected cost efficiency, reflected in a lower efficiency ratio (the percentage of costs to revenues) of 63.4%, compared to forecasts of 64.8%. This contributed to a higher net earnings per share (EPS) of $10.91, compared to $8.62 a year earlier.
Despite solid results, Goldman Sachs (similar to JP Morgan Chase) is trading down about -0.5% today. The market's reaction to the results remains neutral, with the prospect of strengthening earnings trends likely to offer long-term potential for the bank's growth rather than a short-term rebound.
Q2 2025 Results:
Revenues:
-
Net Revenue: $14.58 billion (+15% y/y); estimates: $13.53 billion
-
FICC Sales & Trading Revenue: $3.47 billion; estimates: $3.26 billion
-
Equities Sales & Trading Revenue: $4.30 billion; estimates: $3.72 billion
-
Global Banking & Markets Net Revenues: $10.12 billion (+24% y/y); estimates: $9.03 billion
-
Investment Banking Revenue: $2.19 billion (+27% y/y); estimates: $1.8 billion
-
Advisory Revenue: $1.17 billion (+71% y/y); estimates: $852.7 million
-
Equity Underwriting Revenue: $428 million (+1.2% y/y); estimates: $384.8 million
-
Debt Underwriting Revenue: $589 million (-5.3% y/y); estimates: $592.5 million
-
Net Interest Income: $3.10 billion; estimates: $2.43 billion
Earnings & Profitability Ratios:
-
EPS: $10.91 (vs. $8.62 y/y)
-
Adj. EPS: $10.91; estimates: $9.77
-
ROE (Return on Equity): +12.8%; estimates: +11.3%
-
Efficiency Ratio: 63.4%; estimates: 64.8%
Costs & Losses:
-
Platform Solutions Pretax Loss: $57 million; estimates: $85.6 million loss
-
Provision for Credit Losses: $384 million (+36% y/y)
-
Total Operating Expenses: $9.24 billion (+8.3% y/y)
Balance Sheet:
-
Total Deposits: $466 billion (-1.1% q/q)
-
Standardized CET1 Ratio: 14.5%; estimates: 14.7%
-
Book Value Per Share: $349.74 (vs. $327.13 y/y)
-
Assets Under Management: $3.29 trillion (+12% y/y)
-
Total AUS Net Inflows: $5 billion (-93% y/y)
-
Loans: $217 billion; estimates: $211.09 billion

Palo Alto acquires CyberArk. A new leader in cybersecurity!

US OPEN: Blowout Payrolls Signal Slower Path for Rate Cuts?

Market wrap: Oil gains amid US - Iran tensions 📈 European indices muted before US NFP report

Economic calendar: NFP data and US oil inventory report 💡
The material on this page does not constitute as financial advice and does not take into account your level of understanding, investment objectives, financial situation or any other particular needs.
All the information provided, including opinions, market research, mathematical results and technical analyses published on the website or transmitted to you by other means is provided for information purposes only and should in no event be interpreted as an offer of, or solicitation for, a transaction in any financial instrument, nor should the information provided be construed as advice of legal or fiscal nature.
Any investment decisions you make shall be based exclusively on your level of understanding, investment objectives, financial situation or any other particular needs. Any decision to act on information published on the website or transmitted to you by other means is entirely at your own risk. You are solely responsible for such decisions.
If you are in doubt or are not sure that you understand a particular product, instrument, service, or transaction, you should seek professional or legal advice before trading.
Investing in OTC Derivatives carries a high degree of risk, as they are leveraged based products and often small movements in the market could lead to much larger movements in the value of your investment and this could work against you or for you. Please ensure that you fully understand the risks involved, taking into account your investments objectives and level of experience, before trading, and if necessary, seek independent advice.