
Silver prices at the beginning of the year launched a new, strong upward wave, pushing the metal from around $70 to nearly $82, approaching the historical peak from late December 2025. However, a downward move began yesterday, with silver falling about 5% from the local high to $78 and struggling to maintain momentum above the EMA50 (orange line). The RSI currently stands just below 45, and the MACD shows a potentially bearish crossover.
- Open interest in silver as of December 30 stood at 157,391 contracts, indicating an active but not overheated market in terms of total open positions.
- Managed Money (large speculators) holds 29,100 long contracts and 15,092 short contracts, resulting in a net long position of approximately +14,000 contracts.
- On a weekly basis, funds reduced exposure in the last week of December, closing 5,926 long contracts while simultaneously increasing short positions by 1,674 contracts.
- Commercials (Producer/Merchant/Processor/User) hold only 4,680 long contracts against 30,754 short contracts, yielding a net short position of about 26,000 contracts.
- In the past week, Commercials further reduced long positions by 1,153 contracts and increased shorts by 692 contracts, selling into market strength.
- The difference in positioning between Managed Money and Commercials is therefore clear: funds remain net long and expect higher prices, while hedgers (producers) are strongly short.
Historically, this setup in silver tends to appear more often in the later stages of an uptrend rather than at its beginning. Overall, the CoT report suggests that there is still potential for further gains, but the risk asymmetry increasingly favors Commercials, making the market more vulnerable to a correction or an extended consolidation. On the other hand, short concentration is currently high, as the four largest traders control 28.4% of the total open interest on the short side.
From a technical perspective, the silver chart shows a potential bearish double-top formation around >$80 per ounce, which now appears as the key resistance level. Significant support can be found near the EMA200 on the hourly chart, around $76 per ounce.
SILVER (H1 timeframe)
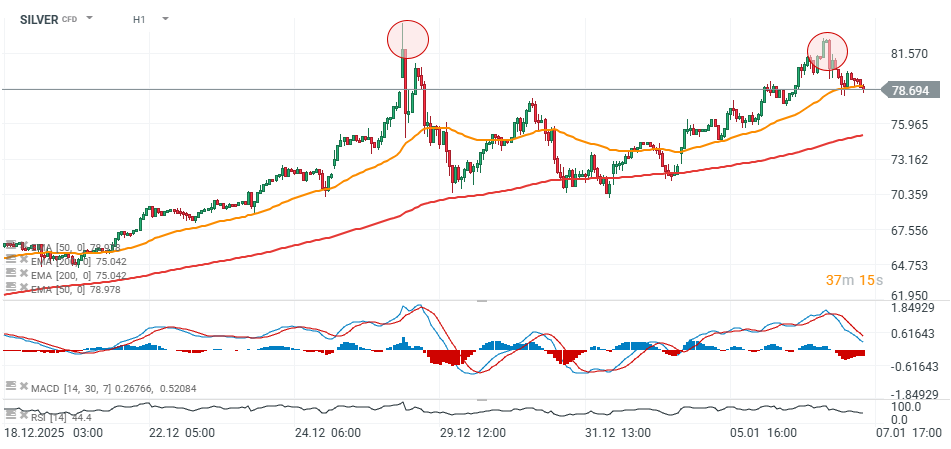
Source: xStation5

Three Markets to Watch in the Week Ahead (03.04.2026)

Daily Summary: A Lull in the Pre-Holiday Calm

Market wrap 📌US indices in focus amid strong NFP data and $100 oil

BREAKING: NFP payrolls skyrocket 🚀 EURUSD back in red 📉
The material on this page does not constitute as financial advice and does not take into account your level of understanding, investment objectives, financial situation or any other particular needs.
All the information provided, including opinions, market research, mathematical results and technical analyses published on the website or transmitted to you by other means is provided for information purposes only and should in no event be interpreted as an offer of, or solicitation for, a transaction in any financial instrument, nor should the information provided be construed as advice of legal or fiscal nature.
Any investment decisions you make shall be based exclusively on your level of understanding, investment objectives, financial situation or any other particular needs. Any decision to act on information published on the website or transmitted to you by other means is entirely at your own risk. You are solely responsible for such decisions.
If you are in doubt or are not sure that you understand a particular product, instrument, service, or transaction, you should seek professional or legal advice before trading.
Investing in OTC Derivatives carries a high degree of risk, as they are leveraged based products and often small movements in the market could lead to much larger movements in the value of your investment and this could work against you or for you. Please ensure that you fully understand the risks involved, taking into account your investments objectives and level of experience, before trading, and if necessary, seek independent advice.