



- Saudi crude loadings from ports on the Persian Gulf rose sharply over the weekend, while the number of vessels at the country’s main export port climbed to its highest level since June.
- Fresh developments in the AI sector are reinforcing expectations for continued investment and stronger semiconductor demand. The MSCI All Country World Index is rising for a fourth consecutive session, reaching its highest level in two weeks.
- Samsung and SK Hynix shares extended gains in Asia, while sentiment was additionally supported by news of Alibaba’s new AI chip, designed to compete with Nvidia’s solutions, as well as the launch of Tencent’s latest image-generation model.
- Brent crude is attempting to snap a four-session losing streak, however. The OIL contract is up more than 1% today and has moved back above $100 per barrel.
S&P 500 earnings outlook remains strong for Q3
Expectations for S&P 500 earnings have improved noticeably over the course of the third quarter. Consensus currently points to year-over-year earnings growth of 28.9%, up from 26.7% expected at the end of June. If the estimate is confirmed, this would mark the third consecutive quarter of earnings growth above 25% and the eighth straight quarter of double-digit growth. Wall Street is expecting a very strong earnings season, which, if results exceed expectations, could become an important driver of further gains.
One particularly notable development is that analysts have raised earnings estimates by 1.6% during the quarter, whereas historically estimates tend to be revised lower over this period. Over the past five years, earnings expectations have declined by an average of around 2.2% during the quarter, while the average decline over the past decade has been around 2.5%. At the same time, 72 S&P 500 companies have issued positive EPS guidance for Q3, compared with 43 companies issuing negative guidance, also representing a strong reading relative to historical averages.
Earnings growth is expected across all 11 sectors of the index, with five projected to post double-digit growth. Energy, Information Technology, Communication Services and Materials are expected to lead the way. Revenue forecasts have also been revised higher: the market now expects year-over-year revenue growth of 11.9%, compared with 10.9% at the end of June. The S&P 500 forward P/E ratio stands at around 19.1, slightly below its five-year average of 19.8 and roughly in line with its 10-year average.
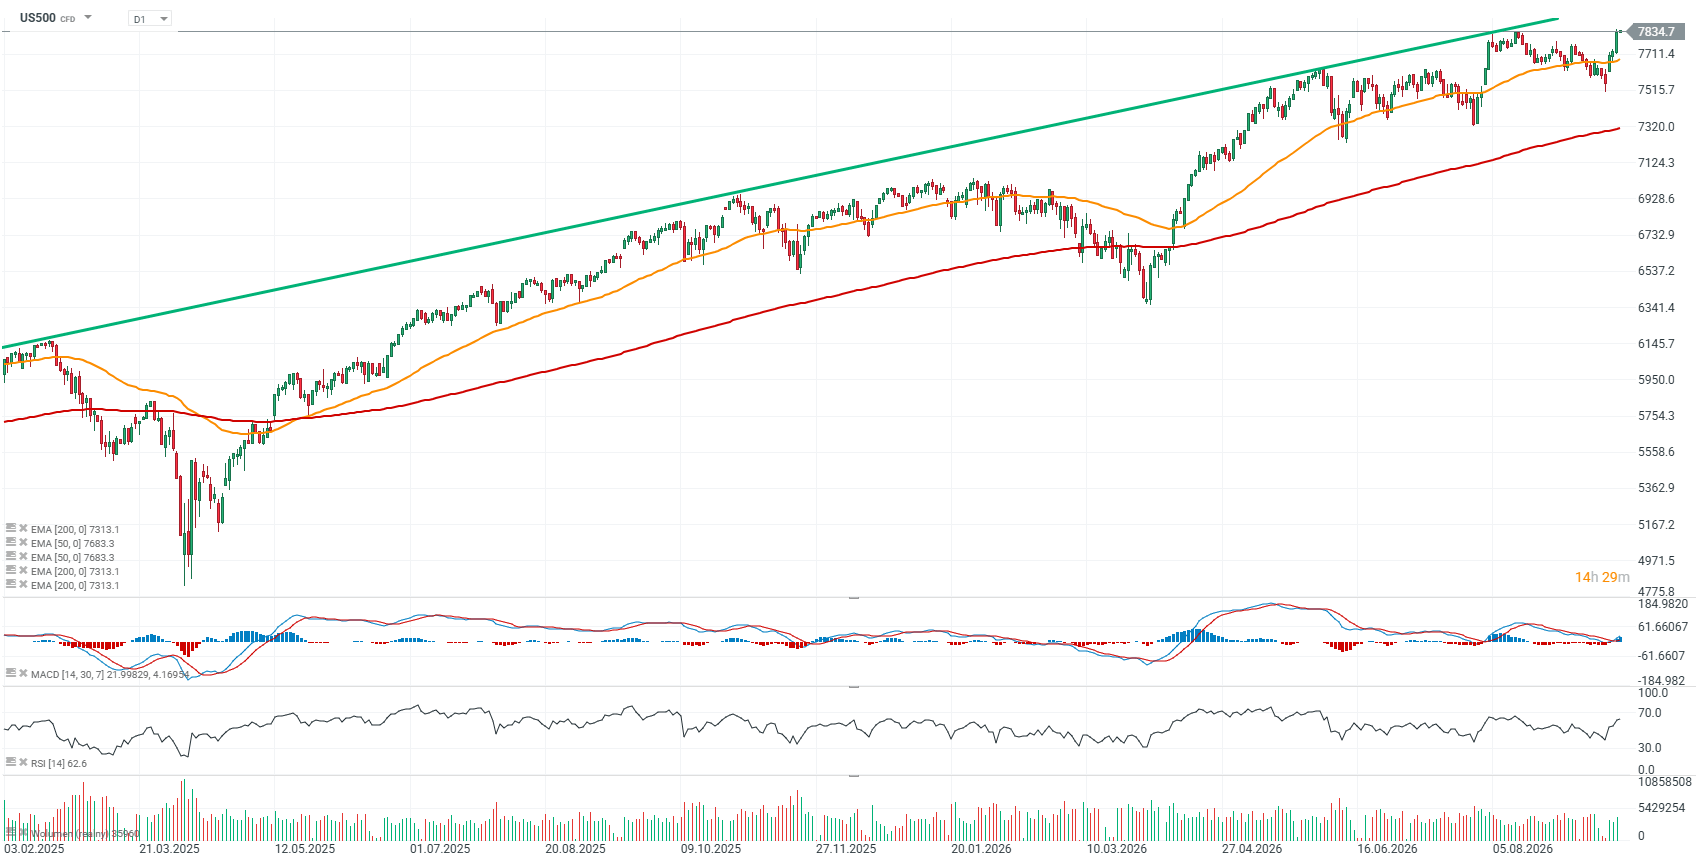
US500 chart (D1 interval)
The S&P 500 futures chart continues to favor buyers, with the index forming a sequence of higher lows and trading near 7,830 points, around the level of the previous peak from June 17. If the breakout continues, the contract could move toward the first major psychological resistance level at 8,000 points. In a bearish scenario, however, an unfavorable technical “double top” formation could begin to emerge. An important support zone appears to be around 7,500–7,600 points, where previous price reactions and the EMA50 moving average (orange line) are located.
Source: xStation5


BREAKING: Iran has offered the US a deal to reopen the Strait of Hormuz, according to Kyodo 🚩 Oil falls sharply


Chart of the Day: Record session for US100 behind us (with a small asterisk)



Economic Calendar - Another day of central bankers' speeches. Is AUDUSD responding to inflation risks?


Morning Briefing: Global Markets Riding AI Wave, Rising Geopolitical Tensions, and Hawkish Central Banks (22.09.2026)
The material on this page does not constitute as financial advice and does not take into account your level of understanding, investment objectives, financial situation or any other particular needs.
All the information provided, including opinions, market research, mathematical results and technical analyses published on the website or transmitted to you by other means is provided for information purposes only and should in no event be interpreted as an offer of, or solicitation for, a transaction in any financial instrument, nor should the information provided be construed as advice of legal or fiscal nature.
Any investment decisions you make shall be based exclusively on your level of understanding, investment objectives, financial situation or any other particular needs. Any decision to act on information published on the website or transmitted to you by other means is entirely at your own risk. You are solely responsible for such decisions.
If you are in doubt or are not sure that you understand a particular product, instrument, service, or transaction, you should seek professional or legal advice before trading.
Investing in OTC Derivatives carries a high degree of risk, as they are leveraged based products and often small movements in the market could lead to much larger movements in the value of your investment and this could work against you or for you. Please ensure that you fully understand the risks involved, taking into account your investments objectives and level of experience, before trading, and if necessary, seek independent advice.