
According to FactSet, the current reporting season shows several strong signals:
- 84% of S&P 500 companies that have reported Q1 2026 results, representing 28% of the index, have beaten earnings per share (EPS) expectations.
- 81% have exceeded revenue forecasts.
- The blended year-over-year earnings growth rate for the S&P 500 in Q1 2026 stands at 15.1%, which—if maintained—would mark the sixth consecutive quarter of double-digit growth.
- At the end of March, earnings growth was expected at 13.1%, but positive surprises and upward revisions have led nine sectors to report better-than-expected results.
- For Q2 2026 guidance, 11 companies have issued negative EPS outlooks, while 9 have provided positive guidance.
- The forward P/E ratio for the S&P 500 currently stands at 20.9, above both the 5-year average of 19.9 and the 10-year average of 18.9.
Record profit margins?
Alongside strong earnings growth, the market is paying close attention to corporate profitability, which is reaching historical highs despite cost pressures, including higher energy prices. Q1 data suggest that U.S. companies are not only increasing revenues but also effectively protecting margins. This phenomenon may be crucial for sustaining current valuations, which already sit above long-term averages. At the same time, sector divergence shows that not all industries are benefiting equally from current conditions.
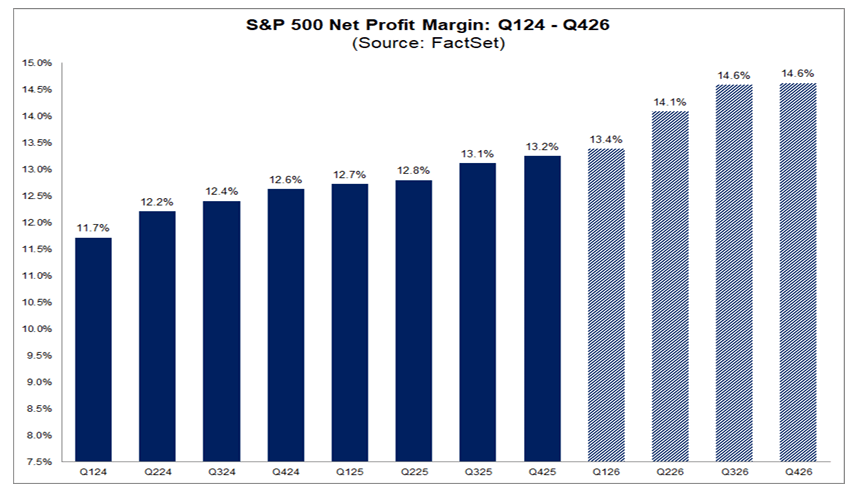
The aggregate net profit margin for the S&P 500 in Q1 2026, according to FactSet, is 13.4%, which—if maintained—would be the highest level since FactSet began tracking this metric in 2009. The previous record was 13.2% in the prior quarter.
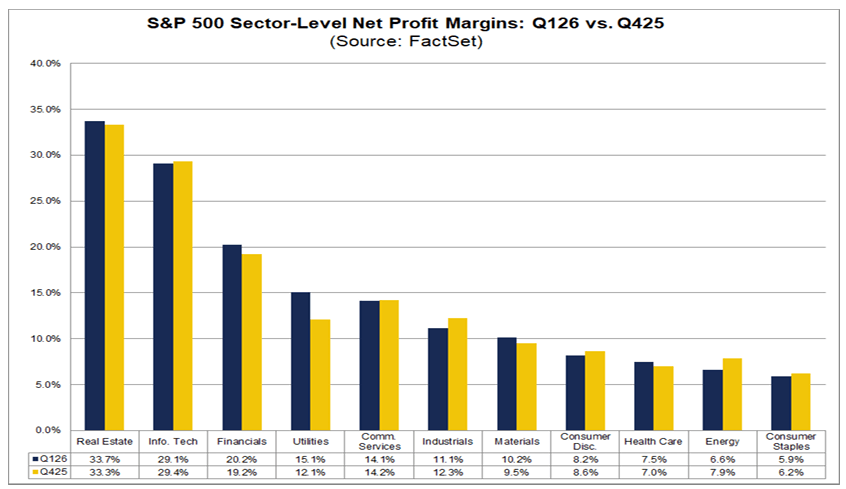
At the sector level, margin trends remain mixed:
- Five sectors are reporting year-over-year margin expansion, led by information technology at 29.1% versus 25.4%.
- Six sectors are seeing margin contraction, with the strongest pressure in communication services at 14.1% versus 16.0%.
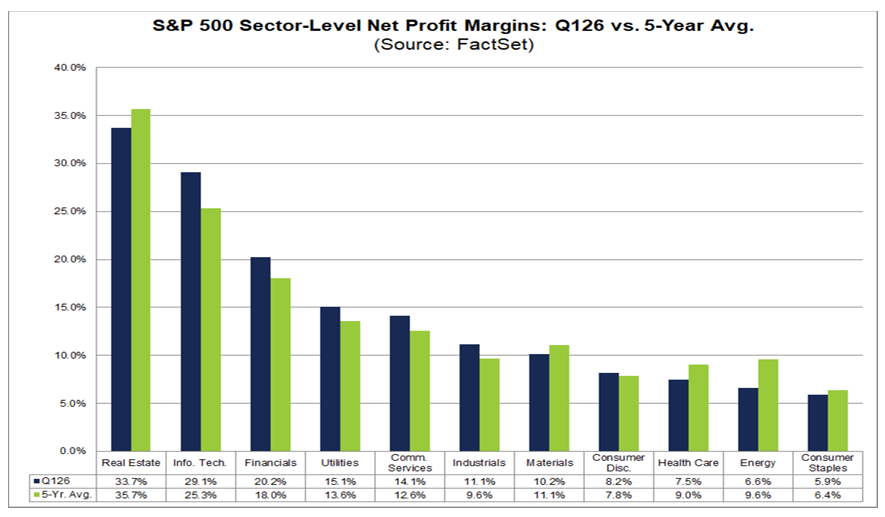
- Six sectors are above their 5-year average margins, again led by technology at 29.2% versus 25.3%.
- Five sectors remain below their 5-year averages, with energy lagging the most at 6.6% versus 9.6%.
- On a quarterly basis, five sectors improved margins versus Q4 2025, led by utilities at 15.1% versus 12.1%.
- Six sectors saw quarter-over-quarter declines, particularly energy at 6.6% versus 7.9% and industrials at 11.1% versus 12.3%.
Analysts expect further margin expansion in the coming quarters of 2026, with projected margins of 14.1% in Q2 and 14.6% in both Q3 and Q4. Notably, technology sector margins remain well above their 5-year average, even as valuations have undergone significant compression.
Source: FactSet
Impressive revenue and earnings growth
The third pillar of the current earnings season is the broad-based strength in revenue and earnings dynamics, confirming the ongoing fundamental resilience of U.S. companies. The data indicate not only a high share of positive surprises but also their above-average magnitude compared to historical norms. At the same time, rising estimate revisions and broad sector participation reinforce the picture of stable growth. However, the market is increasingly pricing in a future where the pace of expansion may shift alongside the economic cycle.
More than 25% of S&P 500 companies have reported Q1 2026 results. The key figures are as follows:
- 84% have beaten EPS estimates, above the 5-year average of 78% and the 10-year average of 76%.
- The EPS surprise magnitude reached 12.3%, compared with the 5-year average of 7.3% and the 10-year average of 7.1%.
- Historical results are based on the full sample of companies, while current figures reflect only those that have reported, which affects interpretation.
- The largest contributions to earnings growth have come from industrials, IT, financials, communication services, and healthcare.
- The energy sector has weighed on results due to downward revisions.
The blended earnings growth rate for the index is now 15.1% year-over-year, up from 13.0% a week earlier and 13.1% at the end of March, indicating clear improvement during the reporting season. If sustained, this would mark the sixth consecutive quarter of double-digit earnings growth for the S&P 500.
Revenue data also remain strong:
- 81% of companies are reporting revenues above expectations, above the 5-year average of 70% and the 10-year average of 67%.
- The revenue surprise magnitude stands at 2.0%, in line with the 5-year average and above the 10-year average of 1.5%.
- Total revenue growth stands at 10.3% year-over-year, compared with 10.0% a week earlier and 9.9% at the end of March.
- If maintained, this would be the fastest revenue growth since Q2 2022, when it stood at 11.0%.
All 11 sectors in the index are reporting year-over-year revenue growth, led by technology, communication services, and financials. In terms of outlook, analysts expect earnings growth of 20.6%, 22.7%, and 20.4% for Q2, Q3, and Q4 of 2026, respectively. For the full year 2026, earnings are projected to grow by 18.6%. The forward P/E ratio remains at 20.9, above both the 5-year and 10-year averages, and higher than the 19.7 level at the end of March. In the remainder of the earnings season, around 180 S&P 500 companies, including 11 from the Dow Jones, are yet to report.
Wall Street greets strong earnings with moderate optimism
Despite solid results, the market’s reward for companies remains moderate. At the same time, the structure of surprises—both in earnings and revenues—suggests continued but selective fundamental strength. The key question is not only whether companies beat expectations, but by how much and in what macro environment.
Market reaction to earnings
The market is rewarding positive EPS surprises in Q1 2026 slightly less than the historical average, while also penalizing negative surprises less severely:
- Companies that beat estimates saw an average share price increase of +0.9% from two days before to two days after the release, compared with a 5-year average of +1.0%.
- Companies with negative surprises recorded an average decline of -2.6%, milder than the 5-year average of -2.9%.
Revenue surprise structure
The revenue surprise structure also remains stronger than historical averages:
- 81% of companies are reporting revenues above expectations.
- 0% are in line with consensus.
- 19% are below forecasts.
- The share of positive revenue surprises exceeds the 1-year average of 73%, the 5-year average of 70%, and the 10-year average of 67%.
- The highest proportion of companies beating expectations is observed in communication services, consumer staples, energy, and real estate, all at 100%.
- The lowest readings are in utilities at 67% and consumer discretionary at 69%.
Magnitude of surprises and sector differences
The average revenue surprise stands at +2.0%, in line with the 5-year average, higher than the 1-year average of +1.6%, and above the 10-year average of +1.5%.
The largest positive deviations are seen in:
- information technology: +5.8%;
- materials: +4.4%.
The weakest positive surprise is observed in:
- consumer discretionary: +0.4%.
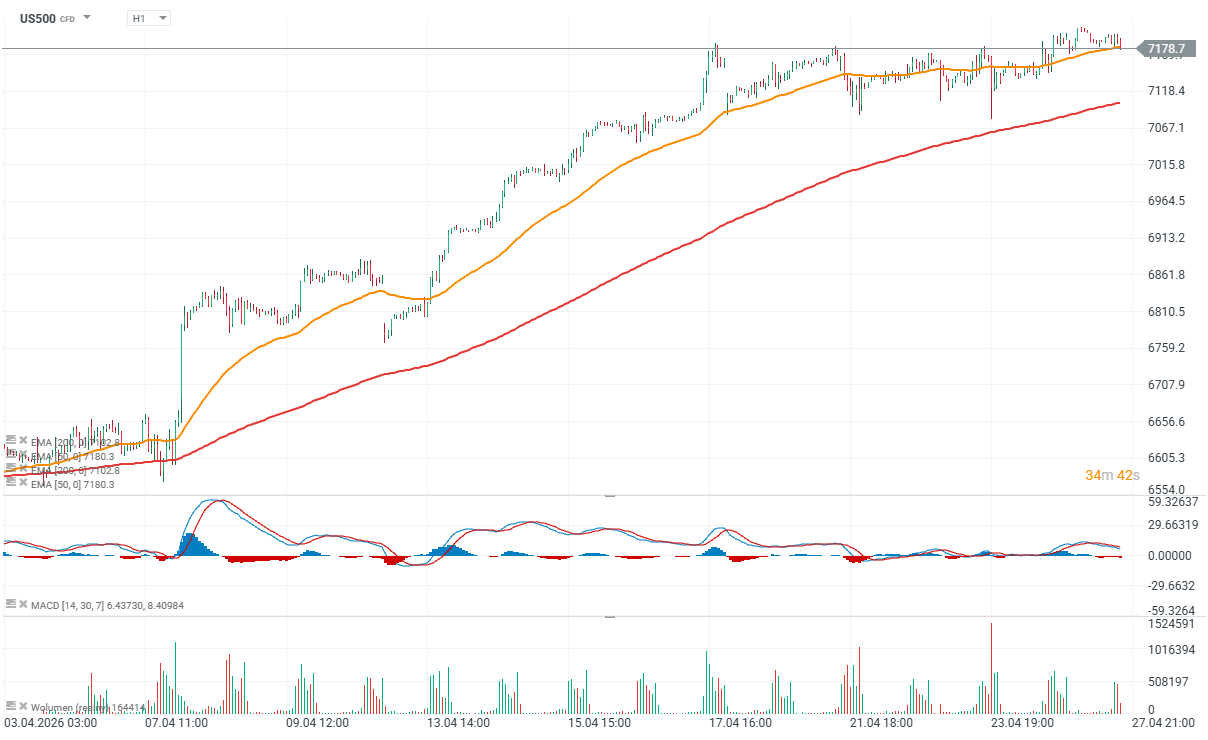
US500 (H1 interval)
![]()
Source: xStation5

Market wrap: ASML and Infineon support sentiments in Europe

Oil extends losses and tests local lows 🚩 Piper Sandler bets on a rebound

NZD the strongest currency after a hawkish surprise from the RBNZ 📄

Economic Calendar: Richmond Fed Index and interesting companies' results ahead 🔎
The material on this page does not constitute as financial advice and does not take into account your level of understanding, investment objectives, financial situation or any other particular needs.
All the information provided, including opinions, market research, mathematical results and technical analyses published on the website or transmitted to you by other means is provided for information purposes only and should in no event be interpreted as an offer of, or solicitation for, a transaction in any financial instrument, nor should the information provided be construed as advice of legal or fiscal nature.
Any investment decisions you make shall be based exclusively on your level of understanding, investment objectives, financial situation or any other particular needs. Any decision to act on information published on the website or transmitted to you by other means is entirely at your own risk. You are solely responsible for such decisions.
If you are in doubt or are not sure that you understand a particular product, instrument, service, or transaction, you should seek professional or legal advice before trading.
Investing in OTC Derivatives carries a high degree of risk, as they are leveraged based products and often small movements in the market could lead to much larger movements in the value of your investment and this could work against you or for you. Please ensure that you fully understand the risks involved, taking into account your investments objectives and level of experience, before trading, and if necessary, seek independent advice.