


The S&P 500 remains close to its all-time highs and, following earnings reports from 91% of the index’s companies (as of Friday, May 15), FactSet data shows that 84% of firms delivered earnings per share above expectations, while 80% exceeded revenue forecasts.
- The blended earnings growth rate for S&P 500 companies in Q1 2026 currently stands at 27.7% year-over-year. If maintained, this would mark the strongest earnings growth since Q4 2021, when the index posted growth of 32.0%.
- As recently as March 31, analysts expected Q1 earnings growth of just 13.0%. The sharp upward revision reflects stronger-than-expected corporate results and rising EPS estimates across 10 sectors.
- For Q2 2026, 38 S&P 500 companies have issued negative EPS guidance, while 42 companies released positive earnings guidance.
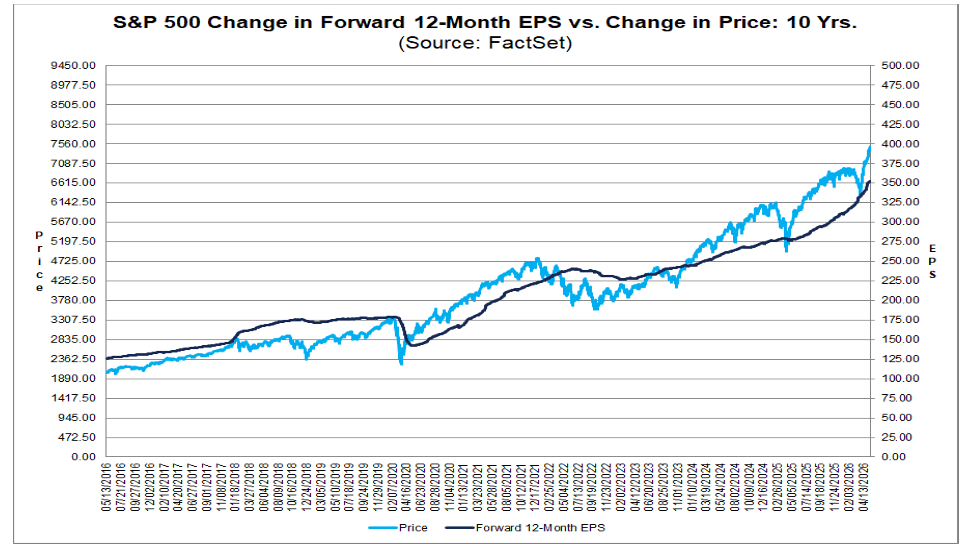
- The forward 12-month P/E ratio for the S&P 500 currently stands at 21.4, above both the 5-year average of 19.9 and the 10-year average of 18.9. However, this valuation premium does not appear excessive given the strong earnings and revenue momentum among US corporations.
Source: FactSet
The Q1 2026 earnings season confirms the continued strength of US companies, particularly in terms of revenue growth. Sales momentum has steadily accelerated in recent months, largely driven by the technology sector.
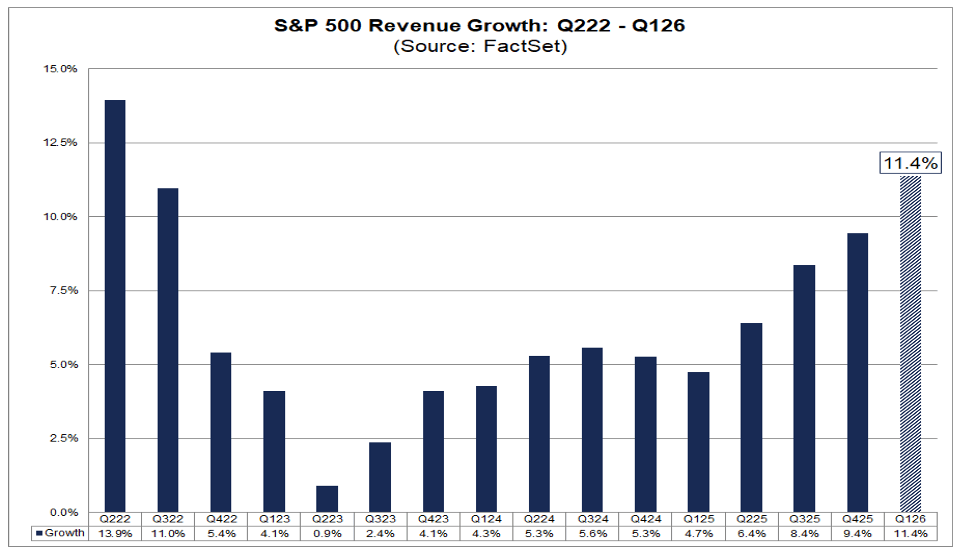
- The blended revenue growth rate for the S&P 500 in Q1 2026 currently stands at 11.4% year-over-year. If sustained through the end of the earnings season, this would represent the strongest revenue growth since Q2 2022, when it reached 13.9%.
- Revenue expectations have been consistently revised upward. On December 31, analysts expected revenue growth of 8.2%; by March 31, expectations rose to 9.9%; and today the estimate stands at 11.4%.
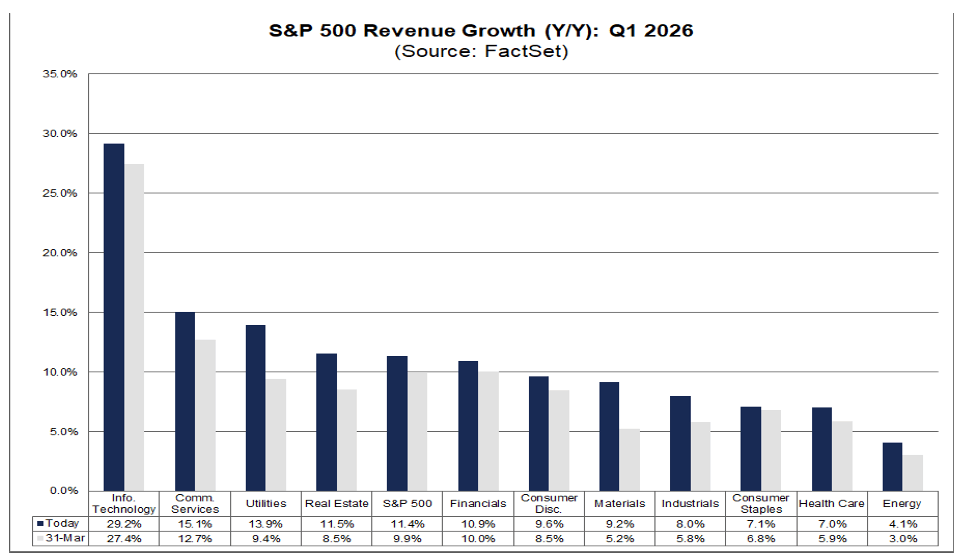
- All 11 sectors within the S&P 500 are reporting positive year-over-year revenue growth. Five sectors are posting double-digit sales growth: Information Technology, Communication Services, Utilities, Real Estate, and Financials.
- The technology sector remains the strongest contributor, with revenues rising 29.2% year-over-year. Within technology, the highest growth rates are reported by Semiconductors & Semiconductor Equipment (+52%), Technology Hardware (+28%), Electronic Equipment (+24%), Software (+19%), Communication Equipment (+16%), and IT Services (+8%).
- Information Technology remains the largest contributor to overall S&P 500 revenue growth. Excluding this sector, the blended revenue growth rate for the index would decline from 11.4% to 9.0%.
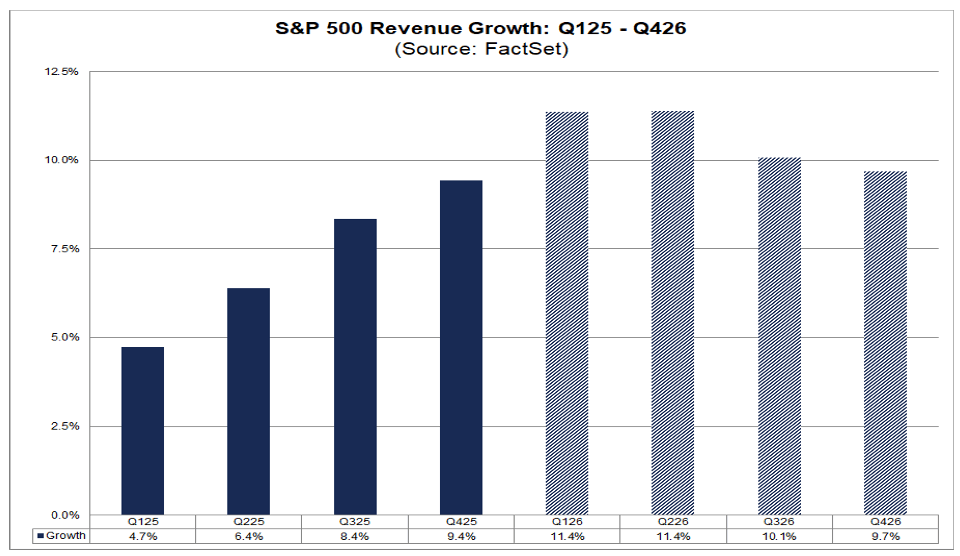
- Analysts nevertheless expect revenue growth to gradually moderate in the second half of 2026. Current projections call for S&P 500 revenue growth of 11.4% in Q2, 10.1% in Q3, and 9.7% in Q4 2026.
Source: FactSet
US companies continue to deliver exceptionally strong earnings growth despite a challenging macroeconomic environment. The technology and communication services sectors remain the primary engines of growth for the broader S&P 500 index.
- If current trends hold through the remainder of earnings season, this will mark the highest percentage of companies reporting positive earnings surprises since Q1 2022, when the figure also reached 84%.
- The average magnitude of positive earnings surprises currently stands at 7.1%, slightly above the 5-year average of 7.3% and in line with the 10-year average.
- Technology companies have been the main driver behind the upward revisions to earnings expectations. In particular, the so-called “Magnificent 7” — Alphabet, Amazon, Meta Platforms, Microsoft, and Nvidia — have played a dominant role.
- The blended earnings growth rate for the S&P 500 has now increased to 27.7% year-over-year, up from 27.6% a week earlier and significantly above the 13.0% expected at the end of March.
- If maintained, this would represent the strongest earnings growth since Q4 2021, when earnings expanded by 32.0%.
- Ten out of eleven sectors are reporting year-over-year earnings growth. Seven sectors are posting double-digit gains, led by Technology, Communication Services, Materials, and Consumer Discretionary.
- Healthcare remains the only sector reporting a year-over-year decline in earnings.
- On the revenue side, 80% of companies exceeded analyst expectations, above both the 5-year average of 70% and the 10-year average of 67%.
- The blended revenue growth rate for the S&P 500 currently stands at 11.4%, versus 11.3% a week earlier and 9.9% at the end of March.
- Utilities companies have recently been the largest contributors to improving revenue growth, while since late March the strongest support has come from Communication Services, Financials, Industrials, Technology, and Healthcare.
Source: FactSet
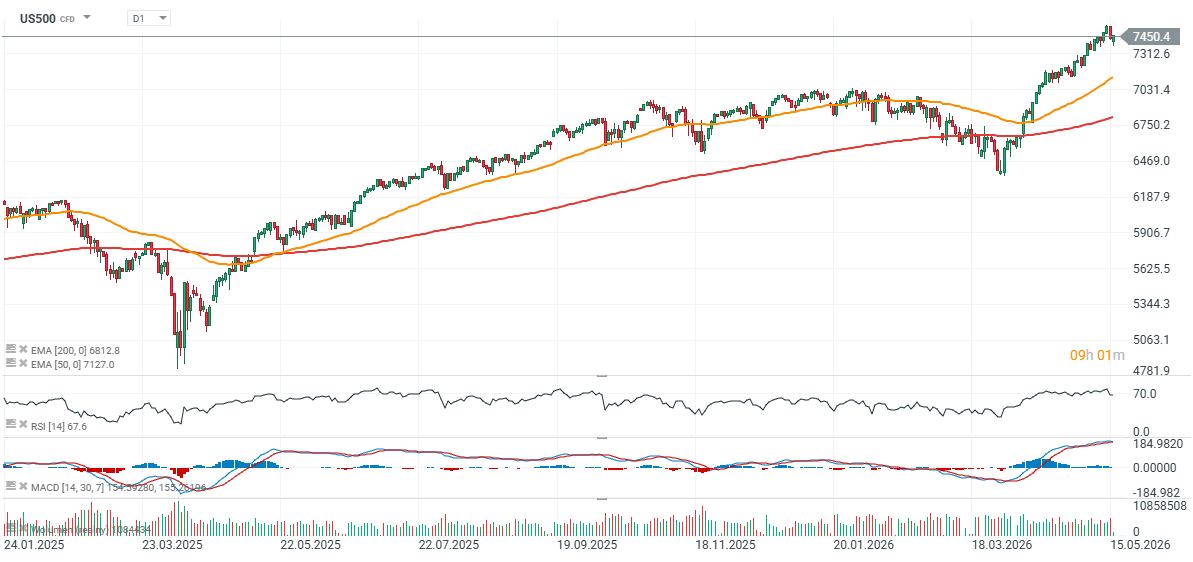
US500 (D1 timeframe)
The S&P 500 index is trading near the 7,500-point level, with markets reacting positively to the strong US earnings season. In the short term, a key support zone remains around 7,100 points (EMA50), while the EMA200 (red line) is currently located near 6,800 points.
Source: xStation5


NZD the strongest currency after a hawkish surprise from the RBNZ 📄

Economic Calendar: Richmond Fed Index and interesting companies' results ahead 🔎



Morning wrap (27.05.2026)


Daily Summary: Semiconductors lift Nasdaq to new highs; DJIA under pressure
The material on this page does not constitute as financial advice and does not take into account your level of understanding, investment objectives, financial situation or any other particular needs.
All the information provided, including opinions, market research, mathematical results and technical analyses published on the website or transmitted to you by other means is provided for information purposes only and should in no event be interpreted as an offer of, or solicitation for, a transaction in any financial instrument, nor should the information provided be construed as advice of legal or fiscal nature.
Any investment decisions you make shall be based exclusively on your level of understanding, investment objectives, financial situation or any other particular needs. Any decision to act on information published on the website or transmitted to you by other means is entirely at your own risk. You are solely responsible for such decisions.
If you are in doubt or are not sure that you understand a particular product, instrument, service, or transaction, you should seek professional or legal advice before trading.
Investing in OTC Derivatives carries a high degree of risk, as they are leveraged based products and often small movements in the market could lead to much larger movements in the value of your investment and this could work against you or for you. Please ensure that you fully understand the risks involved, taking into account your investments objectives and level of experience, before trading, and if necessary, seek independent advice.
