
FOMC minutes release at 7:00 pm BST is a top event of the day. Markets will look for hints on a pace of looming quantitative tightening and content of the document may have a big impact on markets, including indices. Commodity traders will focus on DOE report at 3:30 pm BST. Let's take a look at DE30, OIL and US100.
DE30
Let’s start today’s analysis with the German DAX (DE30). Looking at the H4 interval, one can see that the head and shoulders pattern surfaced on the chart. Taking this into account, the continuation of a downward move is possible. According to the classic technical analysis, as long as the price sits below the neckline of the aforementioned formation (red line on the chart below), the market bearss are at advantage. Considering the bearish scenario, the nearest support can be found at 14,100 pts where previous price reactions are located. In case of a bigger sell-off, the area at 13,780 pts should be considered the next support.
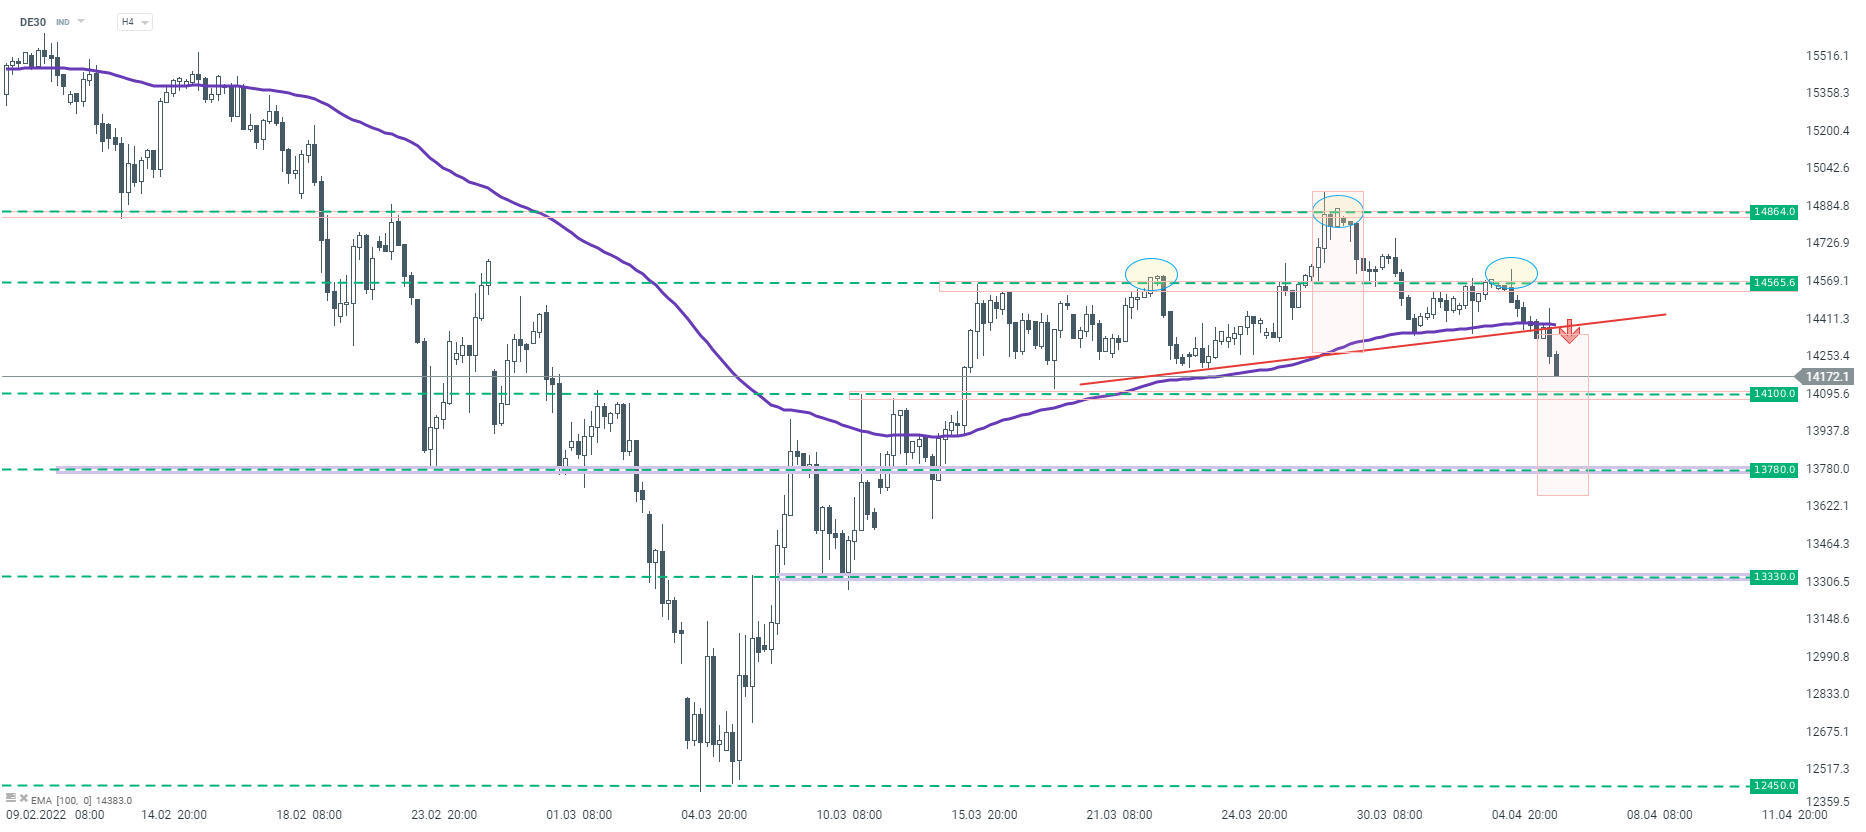 DE30 H4 interval. Source: xStation5
OIL
Next, let’s look at the oil market. Oil price is stuck in a local consolidation move. Looking at the chart on the H1 interval, we can see that buyers managed to keep the price above the $103.40 per barrel. Nevertheless, they did not manage to break through the resistance at $112.00. As long as the price remains between the aforementioned levels, the base scenario is for continuation of a sideways move. Breakout will determine the direction of the next big move.
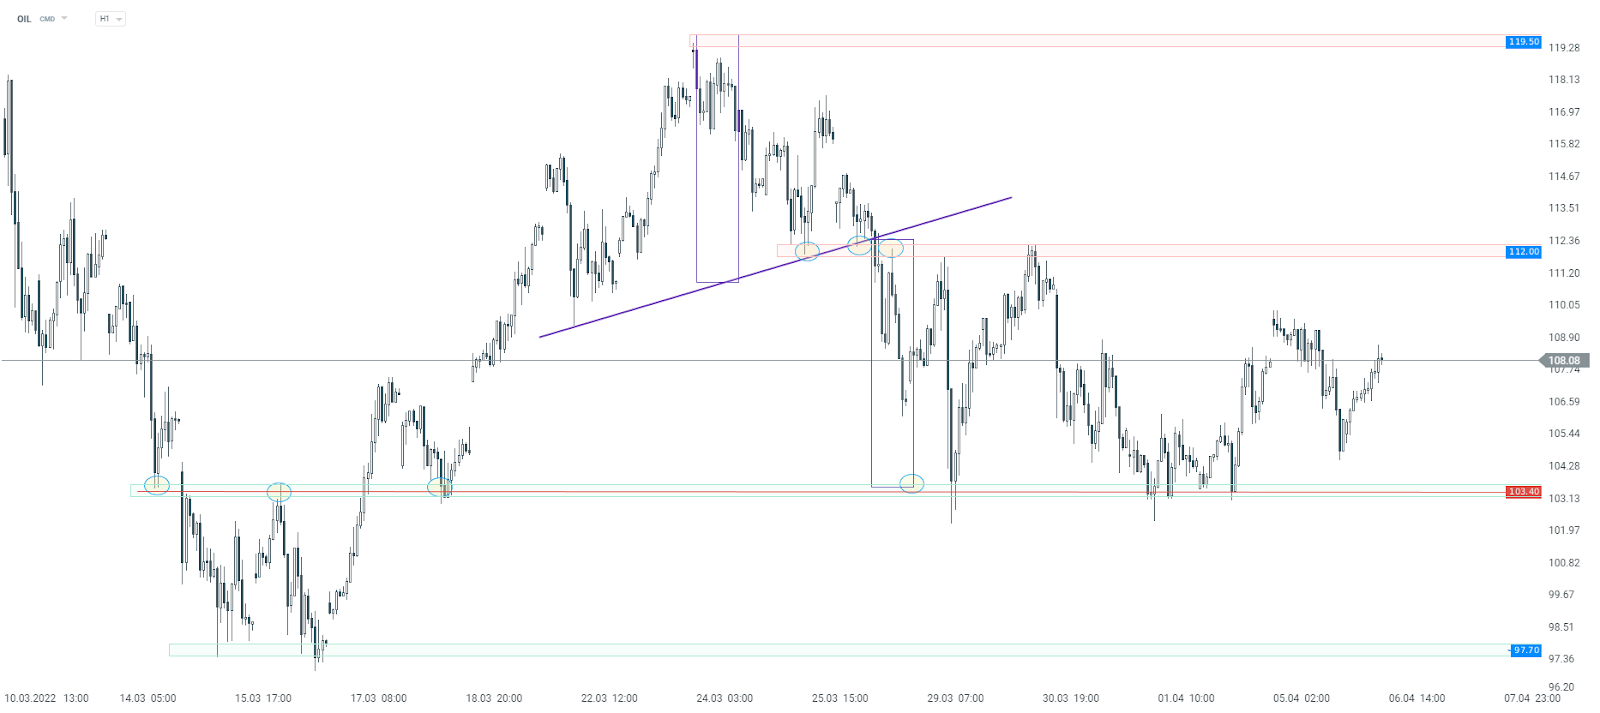
OIL H1 Source: xStation5
US100
Last but not least, let’s take a look at the US100 chart. US index has been trading in an upward move recently. However, the upward momentum weakened at the end of March and downward correction started. Currently we are observing an attempt to break through an important support zone at 14,670 - 14,725. However, if buyers manage to get the zone defended, resumption of an upward movement is possible. On the other hand, if a downward move deepens further, the next support to watch lies at the 14,380 pts, where the 38.2% Fibonacci retracement is located.


افتتاحية الولايات المتحدة: ناسداك ينتعش! أرباح مايكروسوفت ولام ريسيرش تُنعش تجارة الذكاء الاصطناعي!

🛢️ لا يؤدي تصعيد الموقف وتفاقمه إلى زيادة أسعار النفط.

حصاد الأسواق: الأسواق تحاول التعافي بعد أرباح شركات التكنولوجيا الكبرى وقرار الاحتياطي الفيدرالي

ملخص اليوم - بدأ السوق يشكك في رفع أسعار الفائدة بعد تصريحات وارش، لكن ترامب قضى على الانتعاش
"لا تشكل المواد الموجودة في هذه الصفحة نصيحة مالية ولا تأخذ في الاعتبار مستوى فهمك أو أهدافك الاستثمارية أو وضعك المالي أو أي احتياجات أخرى معينة. جميع المعلومات المقدمة، بما في ذلك الآراء، وبحوث السوق، والنتائج الرياضية والتحليلات التقنية المنشورة على الموقع الإلكتروني أو المرسلة إليك بوسائل أخرى، يتم توفيرها لأغراض المعلومات فقط، ولا ينبغي بأي حال من الأحوال تفسيرها على أنها عرض أو التماس لمعاملة في أي أداة مالية، ولا ينبغي تفسير المعلومات المقدمة على أنها مشورة ذات طبيعة قانونية أو مالية. أي قرارات استثمارية تتخذها يجب أن تستند حصرا إلى مستوى فهمك، أو أهدافك الاستثمارية، أو وضعك المالي، أو أي احتياجات أخرى معينة. إن أي قرار بالتصرف بناء على المعلومات المنشورة على الموقع الإلكتروني أو المرسلة إليك بوسائل أخرى هو على مسؤوليتك الخاصة تماما. أنت وحدك المسؤول عن مثل هذه القرارات. إذا كنت في شك أو غير متأكد من أنك تفهم منتجا معينا أو أداة أو خدمة أو معاملة معينة ، فيجب عليك طلب المشورة المهنية أو القانونية قبل التداول. الاستثمار في العقود مقابل الفروقات (CFDs) يحمل درجة عالية من المخاطر، لأنها منتجات قائمة على الرافعة المالية وحركات صغيرة في كثير من الأحيان في السوق يمكن أن يؤدي إلى تحركات أكبر بكثير في قيمة الاستثمار الخاص بك، وهذا يمكن أن يعمل ضدك أو لصالحك. يرجى التأكد من فهمك الكامل للمخاطر التي ينطوي عليها الأمر، مع الأخذ في الاعتبار أهداف الاستثمارات ومستوى الخبرة، قبل التداول، وإذا لزم الأمر، اطلب المشورة المستقلة. "