
The pair eur/usd has been trading sideways for several weeks. However, recently some evidence has started to emerge that may suggest a potential recovery of the euro against the US dollar.
Daily time frame chart.
In the daily time frame, we can see that the buyers regained control of the price near the lower limit of the range, close to 1,036. As long as the price remains above this zone, we cannot exclude the possibility of a further recovery in the strength of the euro against the US dollar.

EUR/USD, Daily time frame chart. Source: xStation
1-hour time frame chart
When we are analyzing a shorter period of time, we can see that some signs are beginning to emerge that may show that the buying force may soon resume.
The inverted head and shoulders chart pattern could be the trigger for a new bullish momentum in the pair.
However, the lack of liquidity today, due to the US holiday, may affect this structure in the short term.
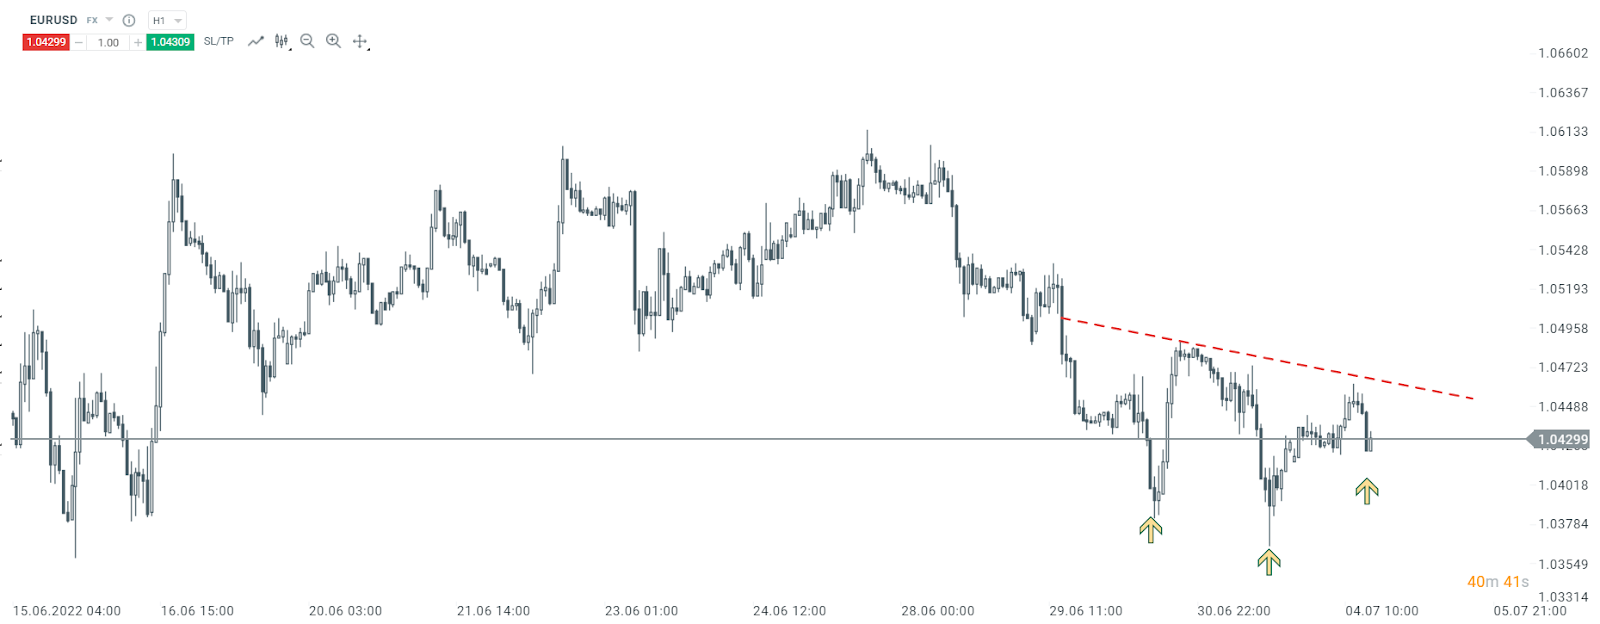
EUR/USD, 1 hour time frame chart. Source: xStation 5
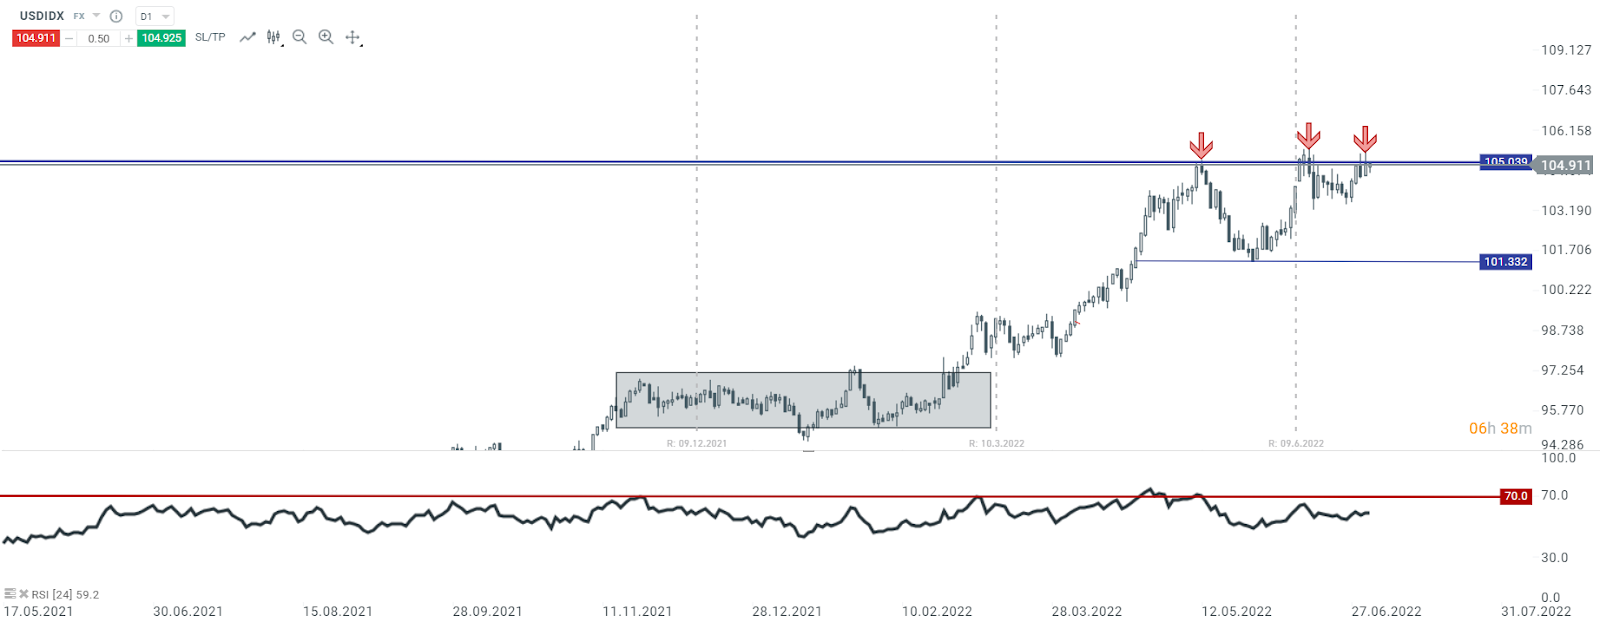
USDIDX - Daily time frame chart
In the US dollar index, the price retested this year's highs and again showed signs of weakness.
This scenario ends up supporting a possible recovery in the EUR/USD pair if sellers regain control of the price at current levels.
USDIDX, Daily time frame chart. Source: xStation 5
During this session, AUD is leading the gains!
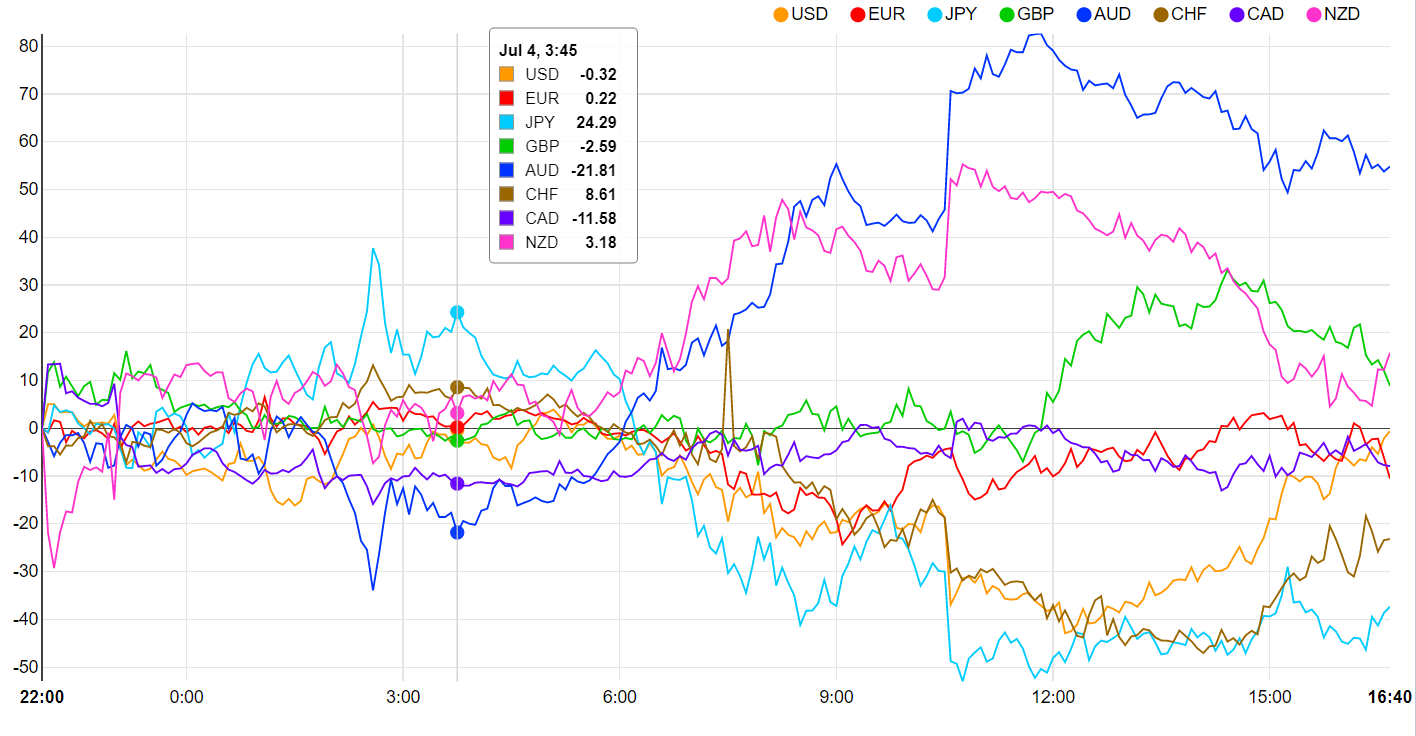
Source: currency-strength.com
Henrique Tomé, XTB Portugal

Market Wrap: Stocks and metals dip as Trump-Xi summit fails to break Iran deadlock 📉 (15.05.2026)

Chart of the Day: Is the Yen Ready for Another Round?

Daily Summary: Market euphoria shows no signs of letting up 🚀

Market Wrap: What does Trump's Beijing visit mean for the markets?
The material on this page does not constitute as financial advice and does not take into account your level of understanding, investment objectives, financial situation or any other particular needs.
All the information provided, including opinions, market research, mathematical results and technical analyses published on the website or transmitted to you by other means is provided for information purposes only and should in no event be interpreted as an offer of, or solicitation for, a transaction in any financial instrument, nor should the information provided be construed as advice of legal or fiscal nature.
Any investment decisions you make shall be based exclusively on your level of understanding, investment objectives, financial situation or any other particular needs. Any decision to act on information published on the website or transmitted to you by other means is entirely at your own risk. You are solely responsible for such decisions.
If you are in doubt or are not sure that you understand a particular product, instrument, service, or transaction, you should seek professional or legal advice before trading.
Investing in OTC Derivatives carries a high degree of risk, as they are leveraged based products and often small movements in the market could lead to much larger movements in the value of your investment and this could work against you or for you. Please ensure that you fully understand the risks involved, taking into account your investments objectives and level of experience, before trading, and if necessary, seek independent advice.