The agreement reached between the USA and Iran brings euphoria to the stock market. The largest European indices are growing by around 1.5%. Some of them – including the Euro Stoxx 50 – are reaching new historical peaks. This strengthening is largely due to companies from the aviation and automotive sectors, which are unequivocally favored by lower crude oil prices.
Geopolitics
According to President Trump, the Strait of Hormuz will be opened after the agreement is signed by the parties on Friday. In the meantime, Iran will clear it of water mines.
This is key information for the markets. Crude oil futures contracts have fallen across the curve and anticipate a price level below 80 dollars by the end of the year.
Monetary Policy
Last week's speech by President Lagarde turned out to be surprisingly hawkish. She emphasized that the decision to raise rates is justified for every inflation projection – the one assuming significant escalation, the baseline scenario, and the scenario assuming de-escalation. She also stated that we are not in an environment where economic growth is absent or significantly threatened.
The increase in interest rate hike valuations resulting from the hawkish conference did not last long. The agreement reached between the USA and Iran brought down the prices of crude oil and gas, which limits inflationary concerns. The market fully prices in an upward move only in December, and this might soon change.
Macroeconomic Data
The release of April industrial production data is scheduled for today. However, we do not expect the reading to make a significant impact on the index. Not only is attention currently anchored on geopolitics, but the data is significantly delayed (US data for May is being published on the same day).
Technical Analysis
Figure 1: EU50 (13.06.2025 - 15.06.2026)
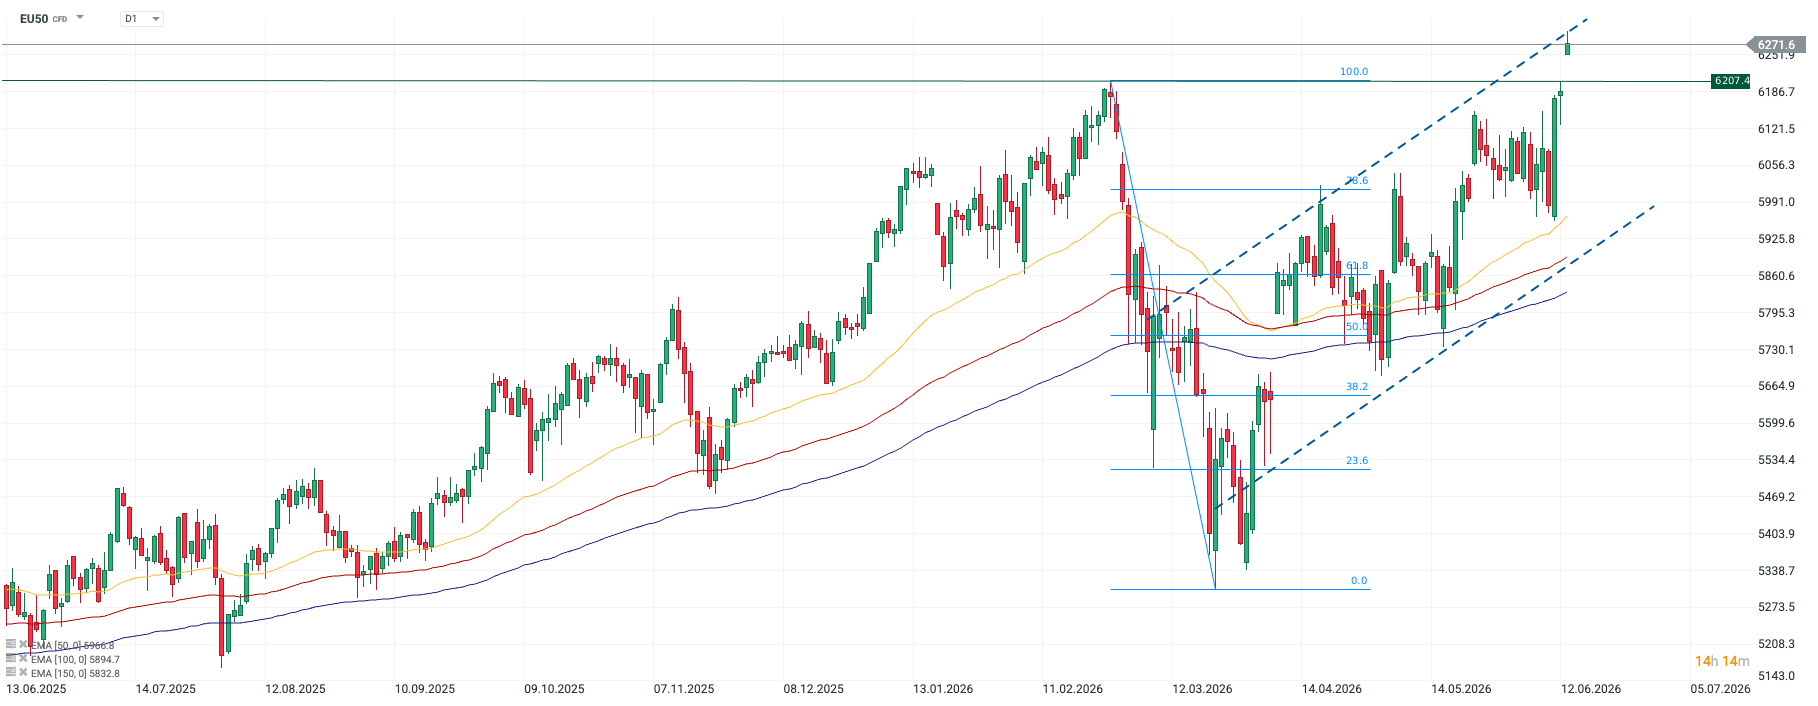 Source: xStation, 15.06.2026
After a deep correction that occurred at the turn of February and March, the chart returned to the upward trend, establishing a new historical peak today around 6270 points. The price is far above all designated moving averages (EMA 50, 100, 150), which are arranged in a pro-growth formation.
The RSI indicator is currently 63.7, suggesting that the market is strongly heated, but technically has not yet entered the extreme overbought zone (above the 70 level). The main MACD lines are high above zero, but the histogram bars are starting to shorten, which may suggest a slow loss of momentum.
—
Michał Jóźwiak, Financial Markets Analyst at XTB

SpaceX shares gain 6% in pre-market 📈

Economic Calendar: Will the Yen Find Support? (15.06.2026)

Morning Wrap: Strait of Hormuz Finally Set to Open (15.06.2026)
Daily summary: Wall Street climbs higher as oil falls 📈 SpaceX surges 28%
The material on this page does not constitute as financial advice and does not take into account your level of understanding, investment objectives, financial situation or any other particular needs.
All the information provided, including opinions, market research, mathematical results and technical analyses published on the website or transmitted to you by other means is provided for information purposes only and should in no event be interpreted as an offer of, or solicitation for, a transaction in any financial instrument, nor should the information provided be construed as advice of legal or fiscal nature.
Any investment decisions you make shall be based exclusively on your level of understanding, investment objectives, financial situation or any other particular needs. Any decision to act on information published on the website or transmitted to you by other means is entirely at your own risk. You are solely responsible for such decisions.
If you are in doubt or are not sure that you understand a particular product, instrument, service, or transaction, you should seek professional or legal advice before trading.
Investing in OTC Derivatives carries a high degree of risk, as they are leveraged based products and often small movements in the market could lead to much larger movements in the value of your investment and this could work against you or for you. Please ensure that you fully understand the risks involved, taking into account your investments objectives and level of experience, before trading, and if necessary, seek independent advice.