
Wall Street indices managed to snap a losing streak yesterday and finished trading higher. Nasdaq-100 (US100) was one of the top performers gaining 2.3%. Tech index bounced off the lows from December 3 (15,550 pts)at the beginning of this week and launched a recovery move. A double bottom pattern surfaced on the chart and 16,400-16,450 pts area can be treated as the neckline. Breaking above could trigger a 900-points upward move (textbook range of the breakout from the pattern). However, the recovery move was halted at the resistance zone marked with 50% retracement of a recent drop, 200-hour moving average (purple line) and psychological 16,000 pts level. Index is pulling back at press time and if declines deepen, a test of the near-term support at 38.2% retracement cannot be ruled out (15,850 pts area).
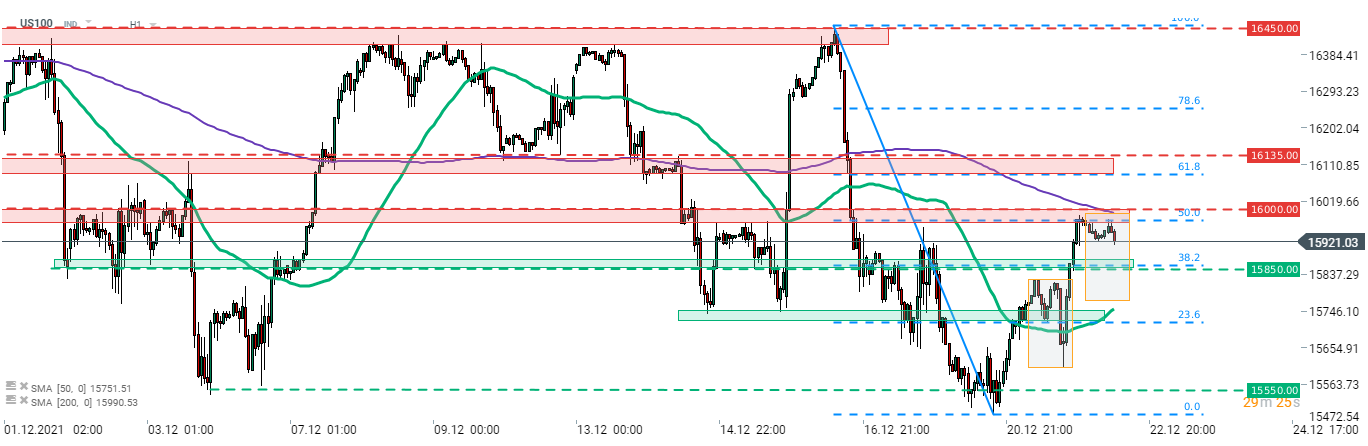 Source: xStation5

Morning Wrap: Emotions Subside After the Truce. The Fed Takes Center Stage in the Markets

Daily Summary - Oil Nearly Erases War Gains as Wall Street Pulls Back Ahead of Fed Decision (16.06.2026)

US OPEN: SpaceX pushes Amazon off the TOP 5 podium. Wall Street awaits Warsh's debut

Nasdaq near record high 🔼 Is a double top forming?
The material on this page does not constitute as financial advice and does not take into account your level of understanding, investment objectives, financial situation or any other particular needs.
All the information provided, including opinions, market research, mathematical results and technical analyses published on the website or transmitted to you by other means is provided for information purposes only and should in no event be interpreted as an offer of, or solicitation for, a transaction in any financial instrument, nor should the information provided be construed as advice of legal or fiscal nature.
Any investment decisions you make shall be based exclusively on your level of understanding, investment objectives, financial situation or any other particular needs. Any decision to act on information published on the website or transmitted to you by other means is entirely at your own risk. You are solely responsible for such decisions.
If you are in doubt or are not sure that you understand a particular product, instrument, service, or transaction, you should seek professional or legal advice before trading.
Investing in OTC Derivatives carries a high degree of risk, as they are leveraged based products and often small movements in the market could lead to much larger movements in the value of your investment and this could work against you or for you. Please ensure that you fully understand the risks involved, taking into account your investments objectives and level of experience, before trading, and if necessary, seek independent advice.