



The yen has recently been one of the strongest currencies in the world, and this market has a new player who openly says he is playing with "loaded" cards. US Treasury Secretary Scott Bessent, during a speech at a Texas university, challenged traders by saying “I am the house now". This means that such a player always wins. He added that he has asymmetric information, i.e., knowledge of what Japanese policymakers and the Bank of Japan are planning, which allows him to appropriately steer the situation in the currency market. Investors can bet against him but, as he suggested, they have no chance against him.
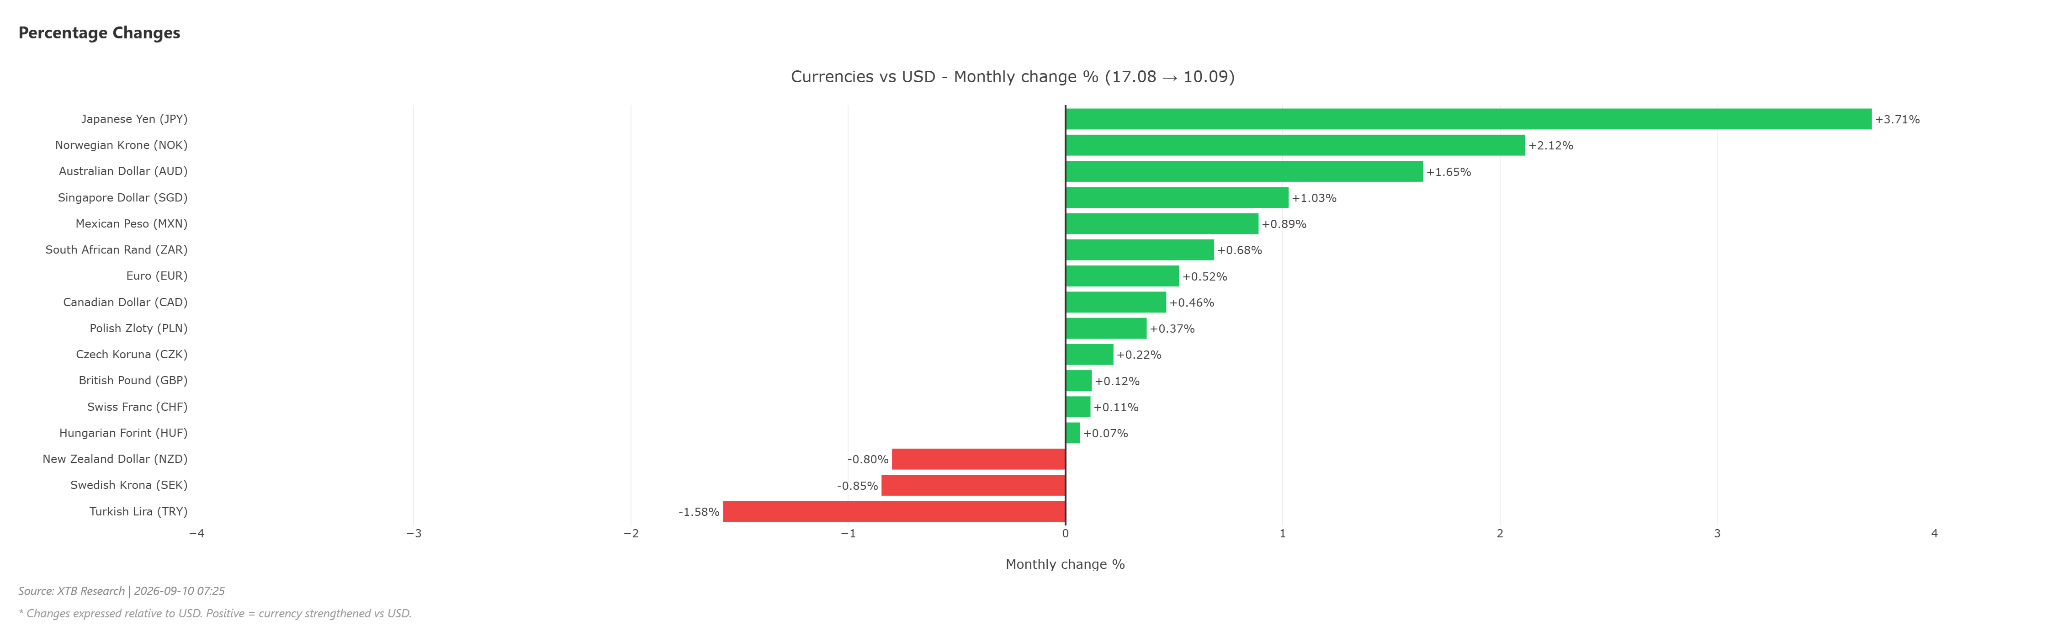 Even with a monthly change, nearly 4% is a lot for the currency market. Source: XTB
Macro and Geopolitics: An unusual alliance between Washington and Tokyo
What we are observing is quite a phenomenon, even though we have already seen similar movements in the yen in 2024. Usually, it is Japan that seeks US approval to support its own currency. This time, Washington itself joined in a joint intervention, selling European assets from its foreign exchange reserves to buy yen. We have observed verbal interventions many times since, and last week's first clear wave of yen strengthening from the 160 level just before the start of the US session may suggest another move by the US Treasury.
Bessent's motivation is purely American. He argues that an excessively weak and unstable yen could force Japan, the largest foreign creditor of the US, to sell US Treasury bonds to fund the intervention. This, in turn, pushes up yields and borrowing costs for American households. In other words, defending the yen has become an element of defending the US debt market.
The second factor behind the move is the Bank of Japan itself. Rhetoric from BoJ members has clearly hardened. Hajime Takata speaks openly about a “regime change" in 2026, driven by a return of inflation and wage pressure. The market is aggressively pricing in a rate hike at the September 17–18 meeting.
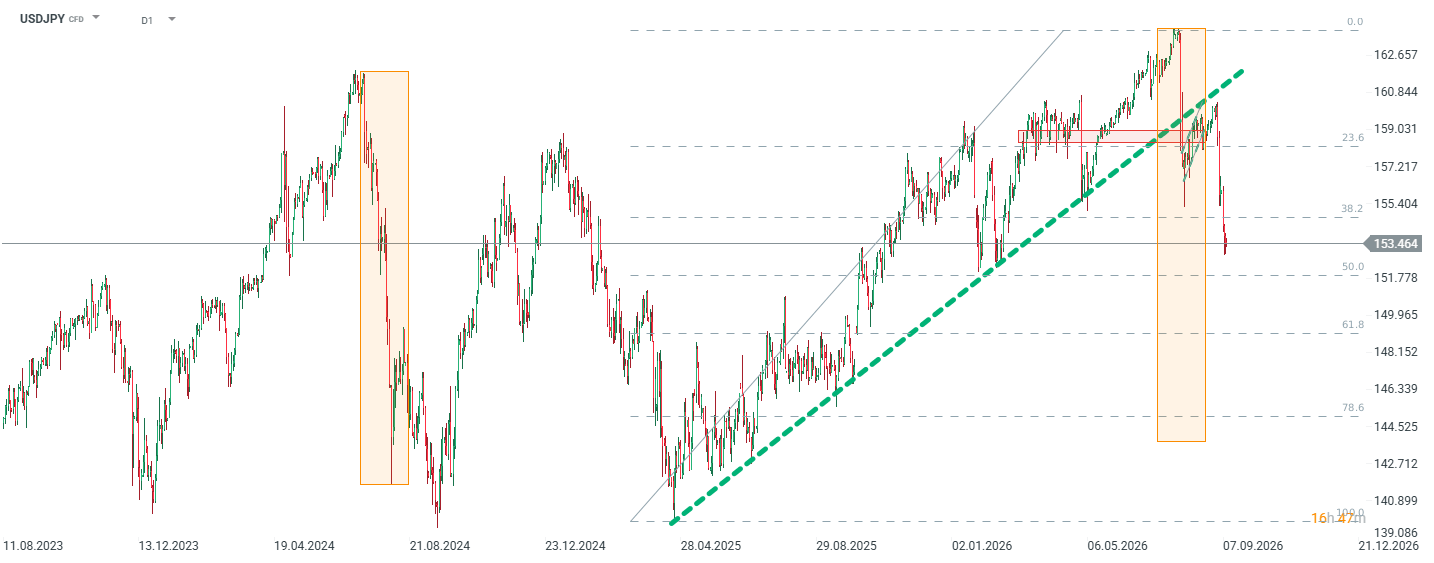
The USDJPY exchange rate almost touched the 164 level at the end of July, which was close to Goldman Sachs' target and was the weakest level for the yen in 40 years. This rate has now plummeted to around the 153 level, and Bessent himself suggested a move down to 150.
However, this is where the main risk of the whole puzzle lies. If the bank raises rates on September 18 but without hawkish forward guidance, the market will get a textbook “sell the fact”.
Positioning: reduction of positions just before a strong move
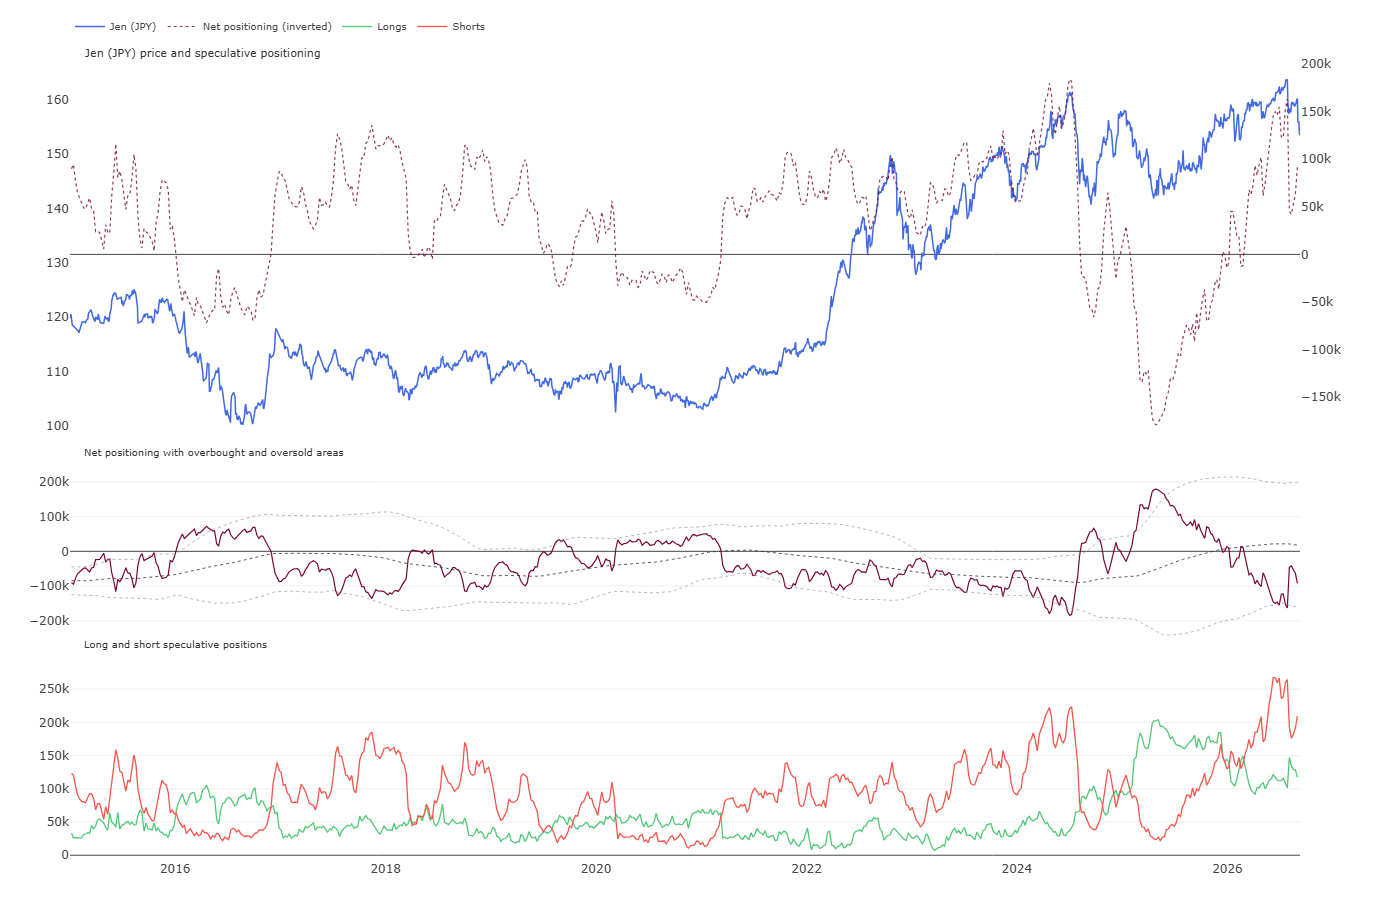
COT data shows why the move is so violent. By July, speculators had built a very large short position on the yen – about 265,000 sell contracts, with a net position reaching about –170k, i.e., below the lower band of extremes.
This structure began to crumble as the number of shorts was significantly reduced in recent weeks, although just before the start of the pullback at the beginning of September, we observed a slight return of sellers. Certainly, the latest CFTC data should show a return to the reduction of shorts and an increase in longs.
Key takeaway: perhaps 60% of the extreme has been squeezed out, but the market is still net short on the yen. For comparison, during a similar move related to the reduction of the carry trade in 2024, the net position did not stop halfway but shifted clearly into positive territory. The ammunition for further yen strengthening still exists.
Technical analysis
On the D1 interval, the picture has changed qualitatively:
- The uptrend line drawn from the lows of April 2025 has been broken – the first violation of this structure in a year and a half. Today, it runs in the vicinity of 158–159.
- The price is between the 38.2% and 50% retracement of the entire 139 - 163.5 impulse. Below, the 61.8% level awaits at key support at 150, although the range of the correction from July 2024 indicates a potentially larger move.
- The 158.0–159.0 zone is now key resistance – the 23.6% retracement, the spring-summer consolidation, the broken trend line, and the annual average (158.28) all converge there. A lasting return above this would invalidate the bearish scenario.
- The analogy with July–August 2024 is very clear: the same mechanism, similar dynamics. Back then, the move amounted to –13% in five weeks. The current one is –6%, i.e., roughly halfway there.
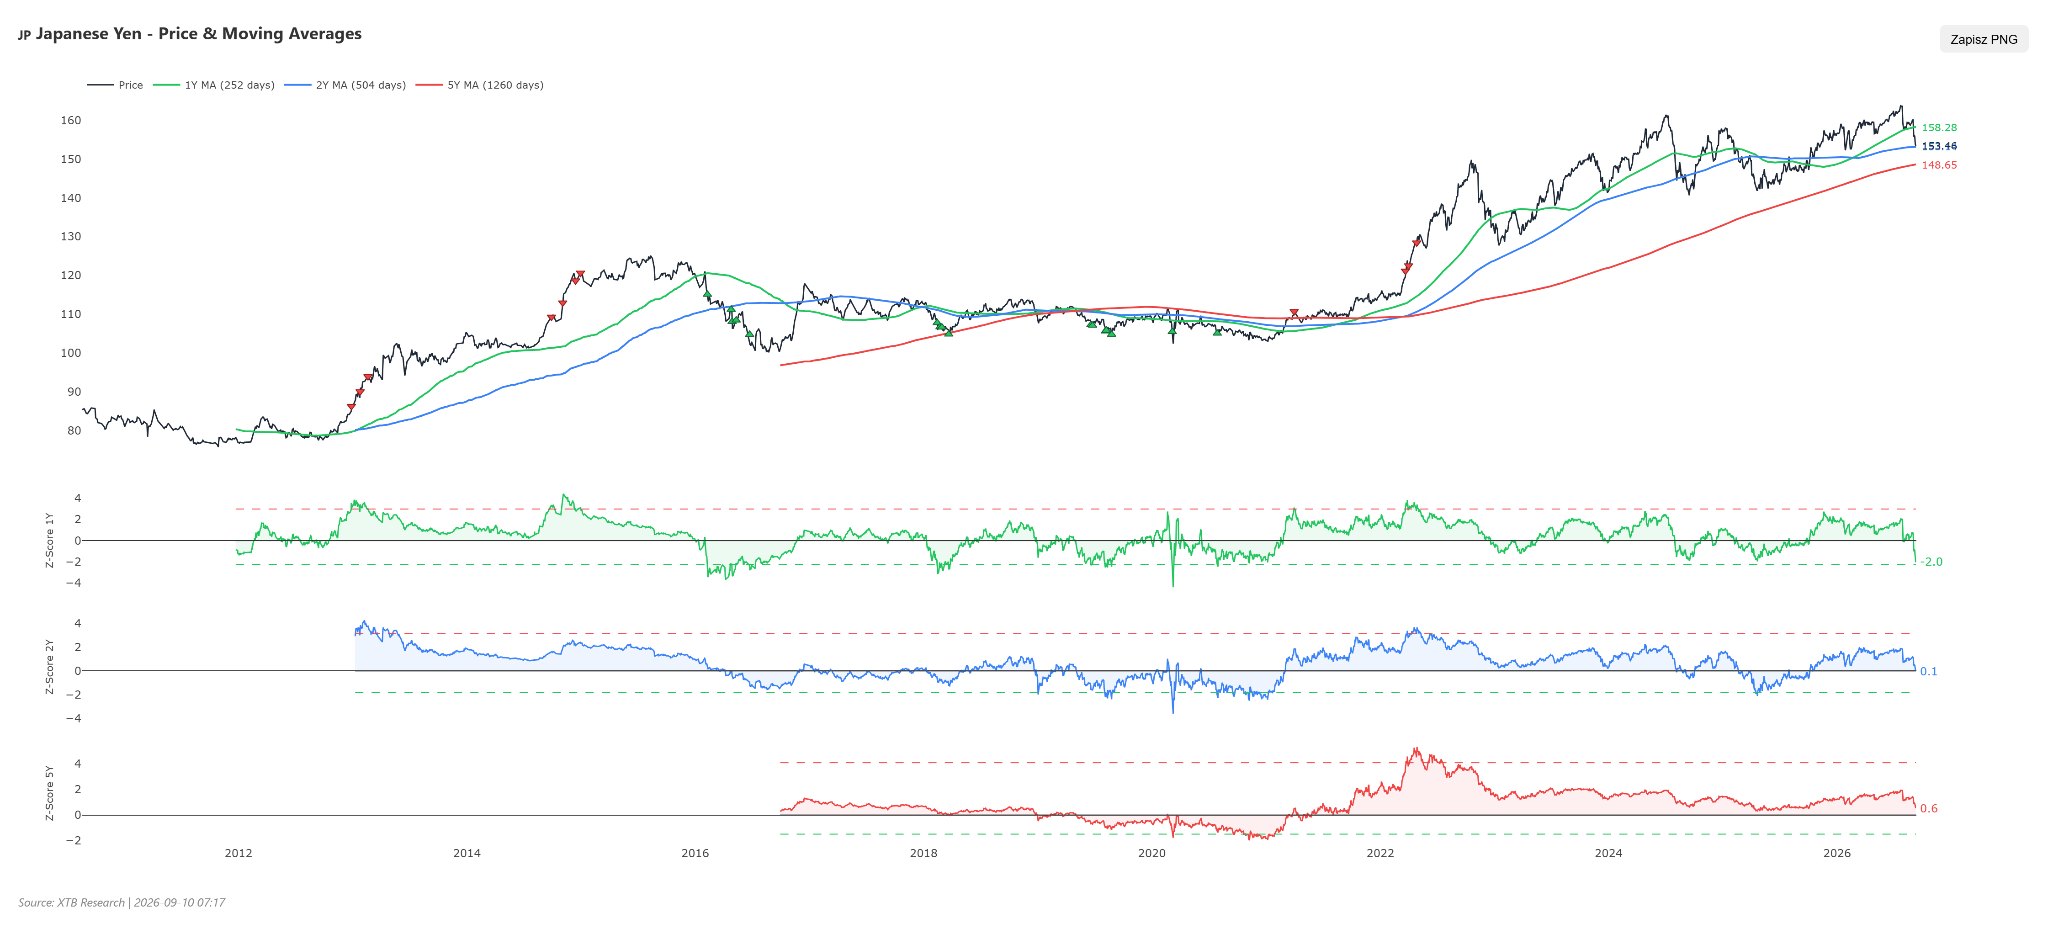
Statistics also look interesting. The Z-score relative to the annual average reached –2.0 – this is the first such extreme since around 2020 and is historically a zone generating rebounds. However, readings for longer horizons are neutral: the two-year average is 153.5 (i.e., exactly the current price, Z-score +0.1), and the five-year average of 148.65 lies below the market.
The conclusion is twofold, and it is what defines USDJPY today: tactically, the move is already oversold, but strategically, the weak yen trend has not yet been broken. The price has returned only to the two-year average. If "regime change" in Japan is real, the room for USDJPY declines is just opening up. However, this is largely a move from the BoJ and the tone from the Fed. The ideal scenario would be an indecisive Warsh next Wednesday and a very concrete Ueda.



📊Morning Wrap: Hawkish Bank of Japan and Trump's Promises Electrify Markets Ahead of PPI Data

🛢️Brent Crude Nearing $100


Market Wrap: Far-right AfD wins in Germany, oil continues to rise (07.09.2026)

⬇️USDJPY drops 1% breaking 155
The material on this page does not constitute as financial advice and does not take into account your level of understanding, investment objectives, financial situation or any other particular needs.
All the information provided, including opinions, market research, mathematical results and technical analyses published on the website or transmitted to you by other means is provided for information purposes only and should in no event be interpreted as an offer of, or solicitation for, a transaction in any financial instrument, nor should the information provided be construed as advice of legal or fiscal nature.
Any investment decisions you make shall be based exclusively on your level of understanding, investment objectives, financial situation or any other particular needs. Any decision to act on information published on the website or transmitted to you by other means is entirely at your own risk. You are solely responsible for such decisions.
If you are in doubt or are not sure that you understand a particular product, instrument, service, or transaction, you should seek professional or legal advice before trading.
Investing in OTC Derivatives carries a high degree of risk, as they are leveraged based products and often small movements in the market could lead to much larger movements in the value of your investment and this could work against you or for you. Please ensure that you fully understand the risks involved, taking into account your investments objectives and level of experience, before trading, and if necessary, seek independent advice.