

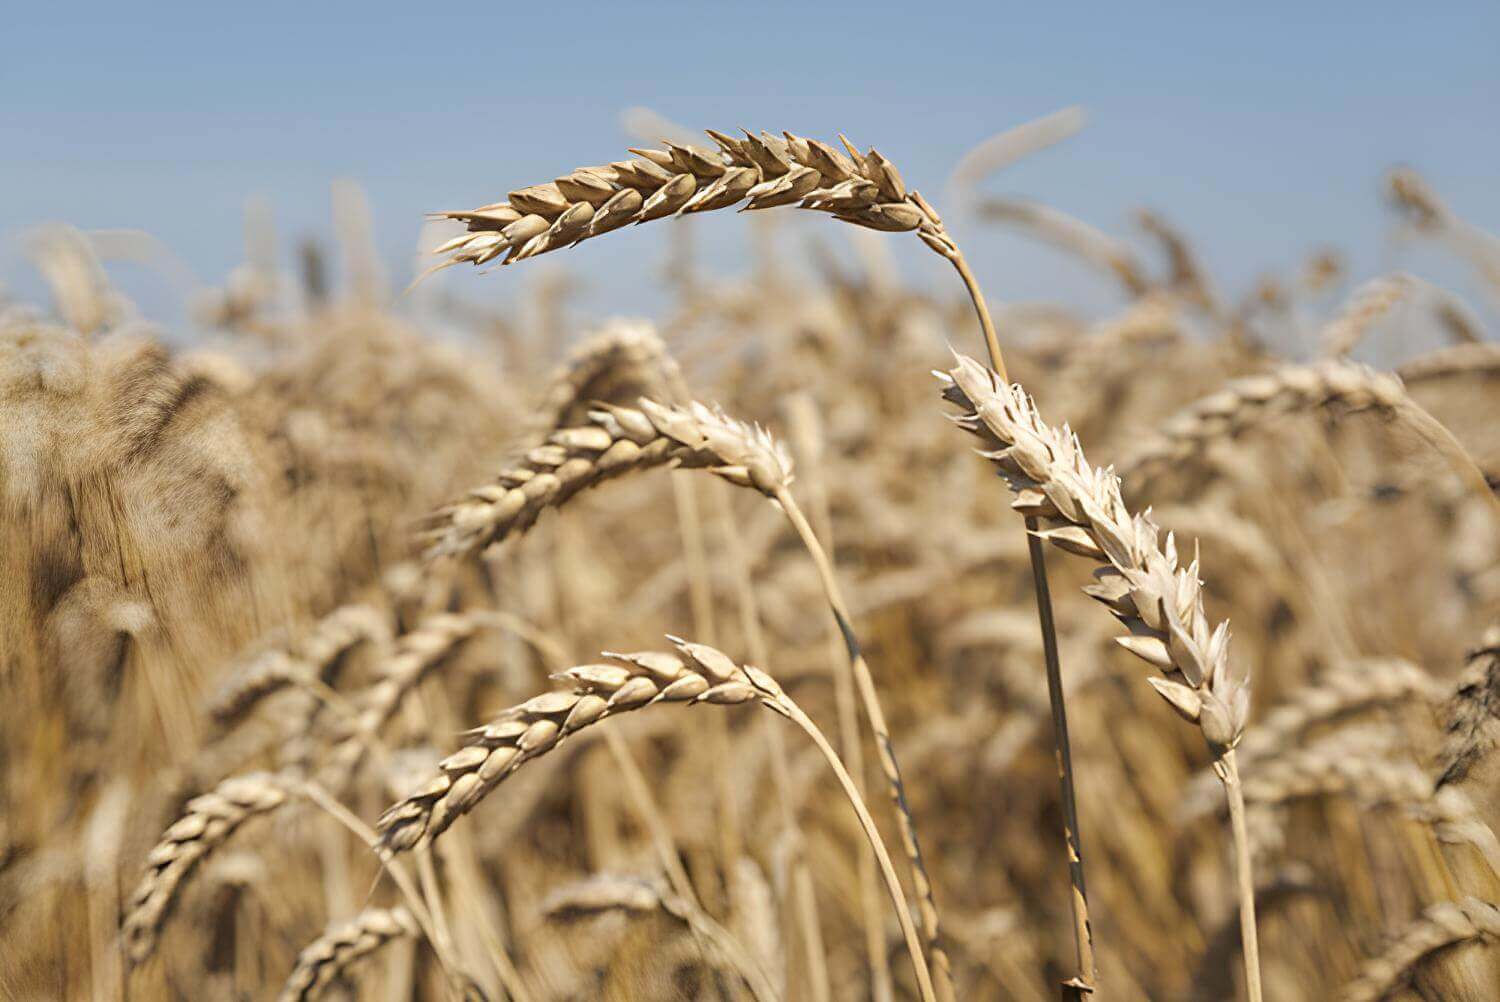

Chicago wheat futures (WHEAT) are up more than 3% today as investors price in a more persistent reduction in supply amid the ongoing war between Ukraine and Russia, with both sides targeting exports and disrupting key logistics routes.
- Despite visits by U.S. diplomats Witkoff and Kushner to Moscow and Kyiv, hopes for diplomatic progress in the Russia-Ukraine war have once again proved short-lived. The declines seen in recent days prompted some profit-taking, as a potential agreement could have facilitated grain exports through the Black Sea again.
- The prospect of renewed negotiations itself reduced part of the geopolitical risk premium, but that premium is now gradually returning as talks appear to have stalled and failed to deliver any significant breakthrough.
- Moscow has suspended export duties on wheat, barley and corn until the end of 2026 in an effort to lower exporters' costs and improve the economics of alternative export routes. However, rail and port capacity constraints remain in place. These bottlenecks continue to limit shipment volumes and sustain concerns about global supply.
WHEAT chart (D1 interval)
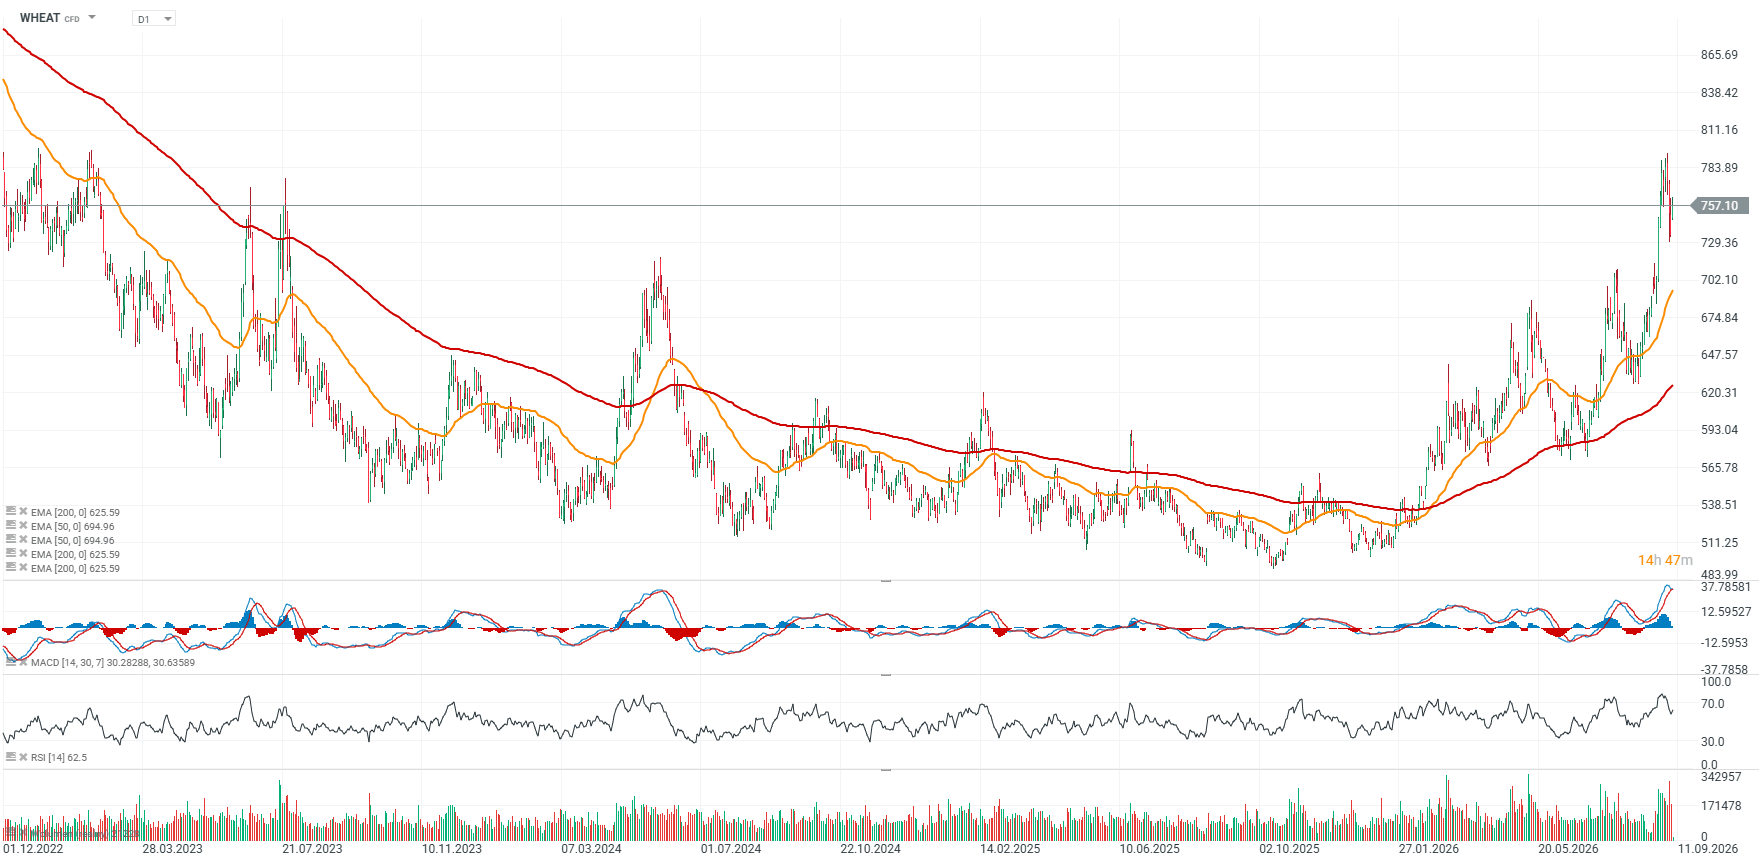
Over the past several sessions, selling pressure in wheat was visible across all major commodity exchanges, from the U.S. to France's MATIF. The pullback after wheat reached levels not seen since February 2023 was bound to be sharp. Following yesterday's U.S. holiday, CBOT traders are returning to the market and are once again buying wheat after an approximately 10% decline.
At present, the key support area appears to be around 730 cents per bushel, while resistance is located near 790-795 cents per bushel based on price action. Below that, an important support zone could be found around 700-710 cents per bushel, where we have also seen significant price reactions in the past.
Wheat is currently trading around 20% above its 200-day EMA, a situation that has historically been relatively rare and points to a very dynamic upward trend. Selling volumes clearly dominated in recent sessions. The RSI has cooled to around 60, while the MACD is showing a potentially bearish crossover of its moving averages.
Source: xStation
What did the latest Commitment of Traders report show for the wheat market?
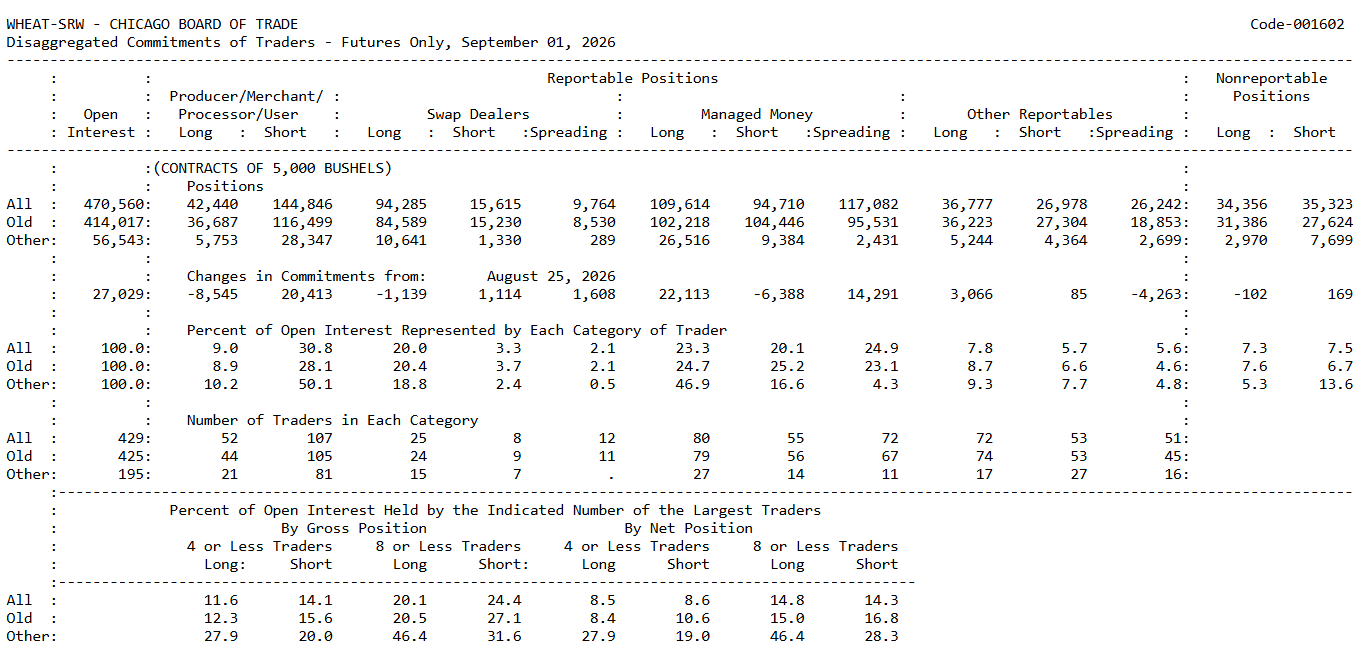
The latest CoT report for Chicago wheat shows a clear divergence between producer positioning and speculative capital. Managed Money, representing large speculators, made a strong move toward the long side over the week, while Commercials, particularly Producers/Merchants, which are the most important part of the commercial category, significantly increased their short exposure.
Importantly, this happened alongside a 27,029-contract increase in open interest to 470,560 contracts, which suggests that fresh capital entered the market rather than the move being driven solely by the closing of existing positions.
Managed Money currently holds 109,614 long contracts versus 94,710 short contracts, leaving the group approximately 14,900 contracts net long. One week earlier, funds were still around 2,200 contracts net short. This means their net position improved by roughly 17,100 contracts over the week.
Even more important is the structure of that move: funds increased gross longs by as much as 22,113 contracts while simultaneously reducing shorts by 6,388. This indicates genuine new positioning for higher prices rather than only short covering.
Commercials are positioned on the other side. Producers/Merchants currently hold 42,440 long contracts and as many as 144,846 short contracts, leaving them around 102,400 contracts net short. One week earlier, their net short position was approximately 79,800 contracts, meaning their negative net exposure increased by around 22,600 contracts in just one week.
The shift is very clear: commercials reduced long exposure by 8,545 contracts and at the same time added as many as 20,413 new shorts. Producers and merchants are therefore using current elevated price levels to hedge future sales.
This means that large speculators are increasingly building a bullish scenario, while the physical side of the market is aggressively selling into the rally. The sharp increase in commercial short positions is also a warning that higher prices are attracting increasingly strong natural hedging supply.
Source: CFTC, Commitment of Traders, September 1



Daily Summary: NFP Spooks Wall Street, Oil Back Near $100


US Open: NFP Has Shifted Fed Expectations, and Wall Street Now Awaits Inflation

🚩 Cocoa futures down 3.5% as ICE inventories rise to 2-year high

🛢️Brent Crude Nearing $100
The material on this page does not constitute as financial advice and does not take into account your level of understanding, investment objectives, financial situation or any other particular needs.
All the information provided, including opinions, market research, mathematical results and technical analyses published on the website or transmitted to you by other means is provided for information purposes only and should in no event be interpreted as an offer of, or solicitation for, a transaction in any financial instrument, nor should the information provided be construed as advice of legal or fiscal nature.
Any investment decisions you make shall be based exclusively on your level of understanding, investment objectives, financial situation or any other particular needs. Any decision to act on information published on the website or transmitted to you by other means is entirely at your own risk. You are solely responsible for such decisions.
If you are in doubt or are not sure that you understand a particular product, instrument, service, or transaction, you should seek professional or legal advice before trading.
Investing in OTC Derivatives carries a high degree of risk, as they are leveraged based products and often small movements in the market could lead to much larger movements in the value of your investment and this could work against you or for you. Please ensure that you fully understand the risks involved, taking into account your investments objectives and level of experience, before trading, and if necessary, seek independent advice.