
Cryptocurrencies have been falling far short of investors’ expectations since the beginning of the year, and sellers currently appear to hold an almost persistent advantage over the demand side. Looking at Bitcoin’s chart, the technical picture does not look encouraging for investors—especially short-term ones.
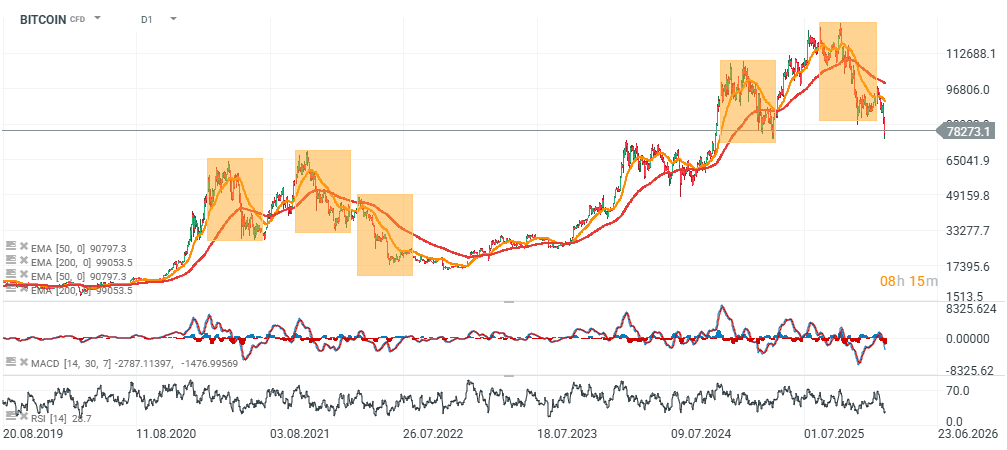
Bitcoin (D1 timeframe)
It is true that the RSI indicator points to an almost record oversold level, with RSI near 27, but the MACD shows clear weakness. Moreover, when we look at Bitcoin’s previous price reactions, as well as the 2020–2021 bull market, we see striking similarities. There is a chance that the ongoing downward move will continue and push BTC down toward key on-chain support levels, which we can look for near USD 50,000 (Realized Price). Short-term investors are increasingly posting losses today—on average nearly 15%—with an average purchase price near USD 90,000, while the spot price is almost 25% below the 200-day EMA (red line), which runs around USD 99,000.
There is therefore no doubt that the current correction (40% from the peak at USD 126,000) can be described as a technical Bitcoin bear market. If history were to serve as a guide, Bitcoin could trade in the USD 50,000–60,000 range in the second half of the year. The biggest risk for the markets remains the situation around Strategy, which has accumulated hundreds of thousands of BTC in recent years (average price approx. USD 76,000 per BTC), as well as selling pressure from US spot ETFs, which for practically the first time since their launch in 2024 are currently showing an average loss of a few percent. As long as BTC is trading below USD 90,000, the advantage remains with sellers, and the four-year halving cycle seems to be “materializing” before our eyes, with a potential “bear-market bottom” in Q4 2026.
Source: xStation5
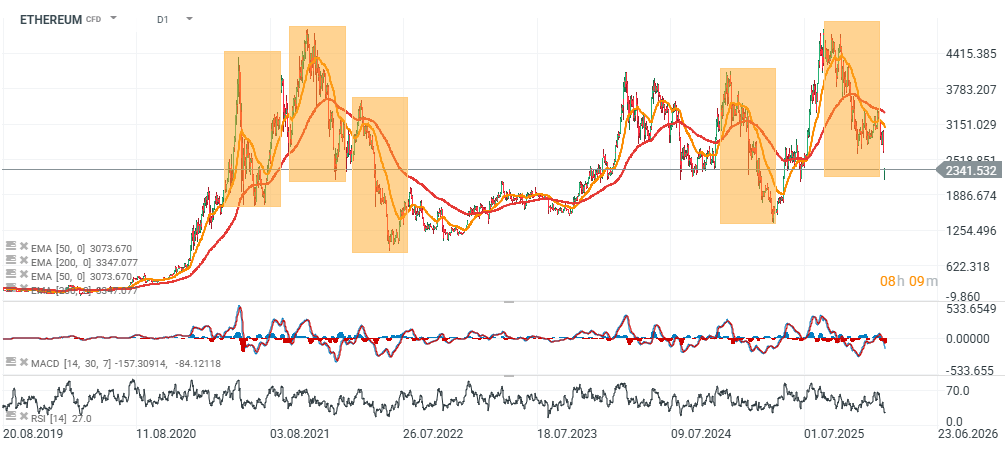
Ethereum (D1 timeframe)
The situation for Ethereum is even more “drastic,” as the correction from the highs is currently close to 55%. While a technical rebound is likely given the scale of the declines, a lasting trend reversal remains less realistic as long as Bitcoin stays under pressure. Similar to Strategy in Bitcoin’s case, Ethereum also has its own “Strategy” in the form of Bit Immersion Digital. The company led by Tom Lee is currently sitting on more than USD 5 billion in unrealized losses on its ETH holdings. While the long-term fundamentals supporting Ethereum’s growing importance as a network benefiting from the mega-trend of tokenization remain intact, capital flows remain cautious, and there is no sign that buyers have the strength to push ETH above USD 3,000–3,300 in the near term—especially if Bitcoin continues to fuel uncertainty in the market.
Source: xStation5
CryptoQuant data show that historically elevated volatility signals a key shift in the market phase. Historically, a z30 range reading above +3 has often preceded strong price moves—both sharp breakouts to the upside and rapid declines. Currently, the downside scenario appears more likely, but a rebound can never be ruled out—especially after a sell-off of the magnitude we have seen recently.

Source: CryptoQuant
Multiple liquidity factors show that Bitcoin is currently operating in an exceptionally difficult market environment. CryptoQuant indicates that it is being weighed down by a persistent lack of liquidity that has been affecting the market for several months. Investors activity (stablecoins) on exchanges is definitely muted.

Source: CryptoQuant

Daily Summary- Return of the Sell-off on Wall Street⬇️

🔴US100 drops nearly 4%

🟡⬇️Gold at its lowest since March

🛢️WTI Crude Below 90 USD Tests the 100-Session Average
The material on this page does not constitute as financial advice and does not take into account your level of understanding, investment objectives, financial situation or any other particular needs.
All the information provided, including opinions, market research, mathematical results and technical analyses published on the website or transmitted to you by other means is provided for information purposes only and should in no event be interpreted as an offer of, or solicitation for, a transaction in any financial instrument, nor should the information provided be construed as advice of legal or fiscal nature.
Any investment decisions you make shall be based exclusively on your level of understanding, investment objectives, financial situation or any other particular needs. Any decision to act on information published on the website or transmitted to you by other means is entirely at your own risk. You are solely responsible for such decisions.
If you are in doubt or are not sure that you understand a particular product, instrument, service, or transaction, you should seek professional or legal advice before trading.
Investing in OTC Derivatives carries a high degree of risk, as they are leveraged based products and often small movements in the market could lead to much larger movements in the value of your investment and this could work against you or for you. Please ensure that you fully understand the risks involved, taking into account your investments objectives and level of experience, before trading, and if necessary, seek independent advice.