



Gold prices opened the week higher on global markets, with gold rising 0.5% to around $4,400 and extending Friday’s gains, while silver is up nearly 1.5%. Precious metals appear to have responded positively to the latest set of U.S. macroeconomic data.
- Friday’s data showed an unexpected decline in U.S. retail sales and weaker consumer sentiment in the University of Michigan survey.
- The figures followed relatively “reassuring” July CPI and PPI inflation reports.
- The latest NFP report also disappointed, while gold appears to be reacting to a reduction in hawkish expectations ahead of the Fed’s autumn policy decisions.
Gold price chart (H4, D1)
On the 4-hour chart, gold remains above $4,300 per ounce and recently halted its decline around this important Fibonacci retracement level (23.6%). RSI and MACD still appear to leave some room for further gains, while an important Fibonacci resistance level is located near $4,600, where stronger price action can also be seen, including the May consolidation that preceded the subsequent decline.
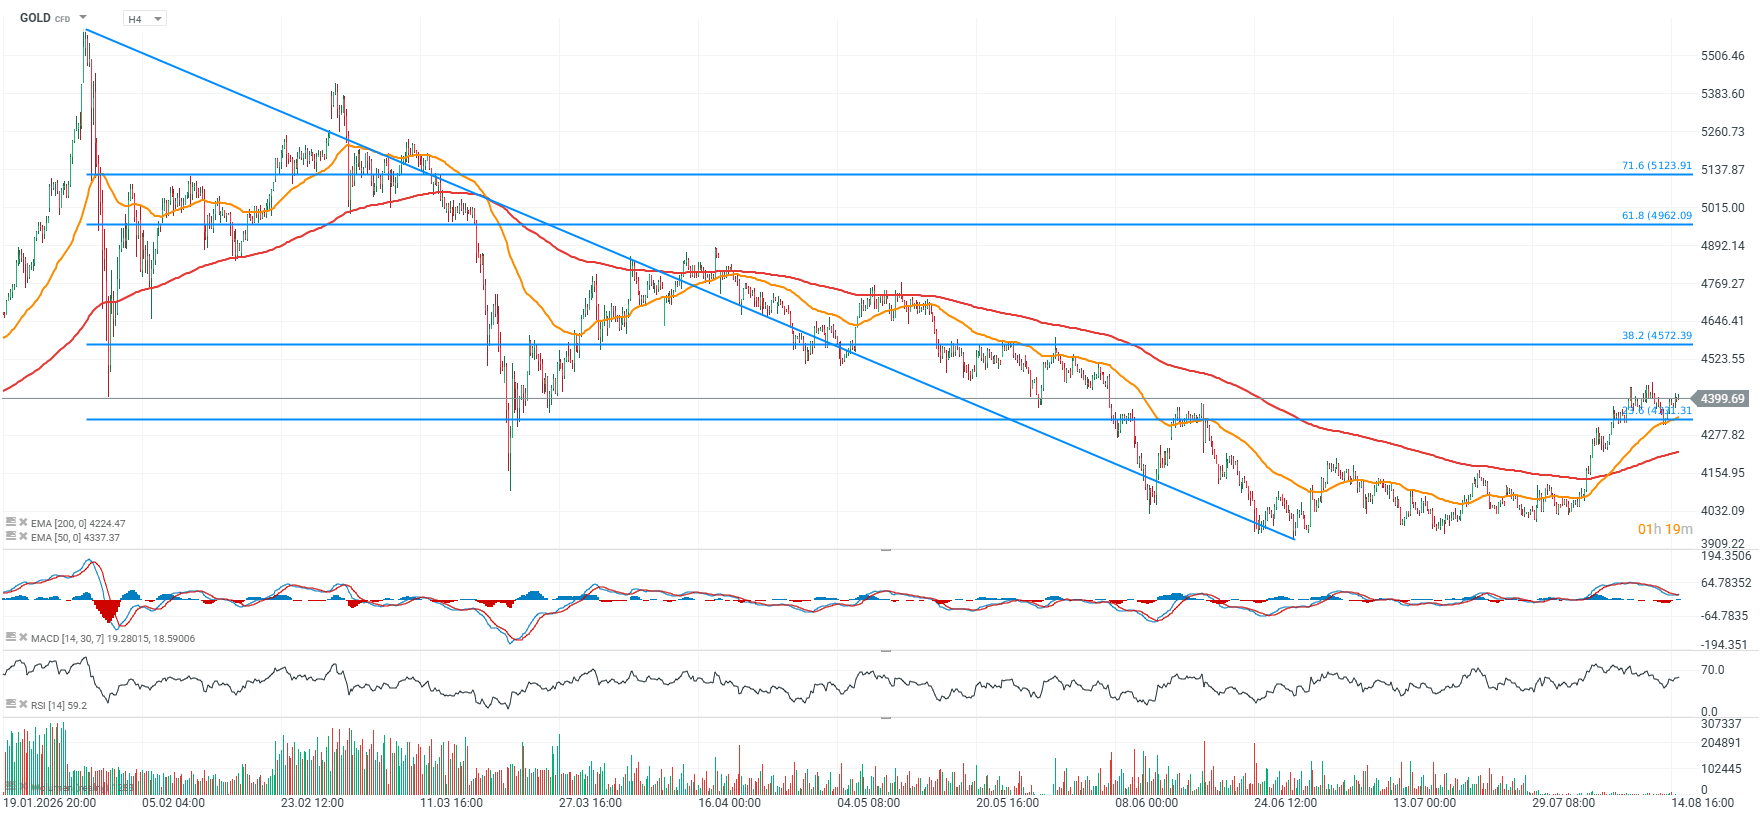
Source: xStation5
On the daily chart, the $4,300 area looks even more important because the 200-session EMA200 (red line) is located there. After briefly falling below this moving average, gold quickly returned to growth. The proximity of the EMA200 itself appears to suggest that, in a scenario where the upward trend resumes, gold could still have considerable room to rise—especially if expectations regarding Fed and ECB policy become more dovish and oil prices gradually decline toward $70–80 per barrel.
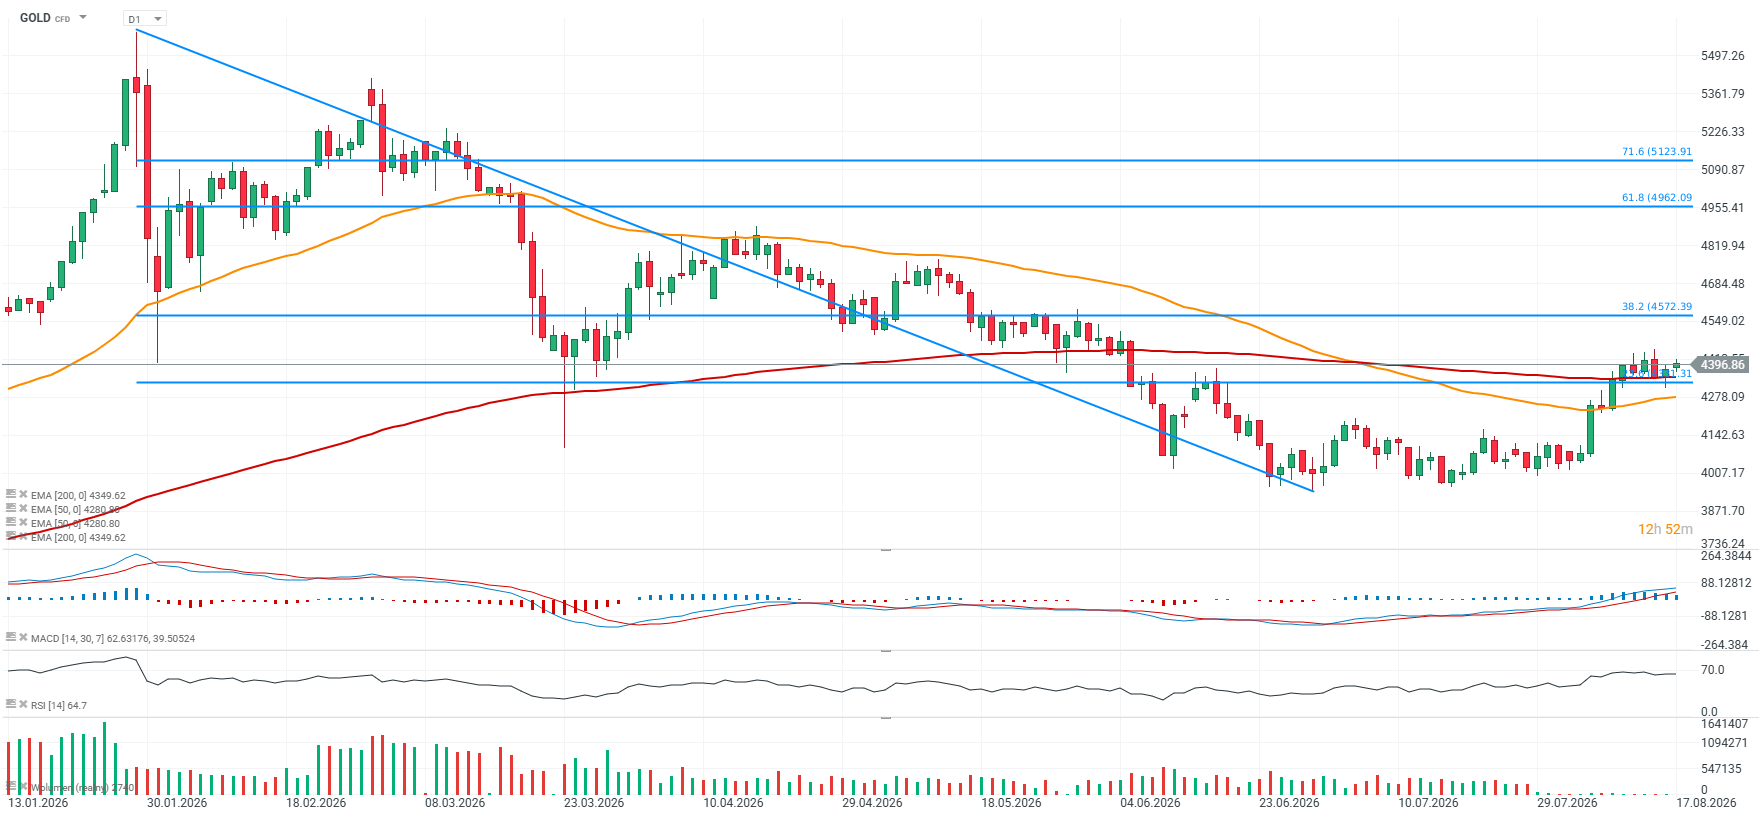 Source: xStation5



Daily Summary: "Heat" of the NFP Print Cools Market Sentiment ⬇️


Three Markets to Watch Next Week (04.09.2026)

🟡Gold drops sharply following strong NFP

BREAKING: NFP with a massive upside; EURUSD dips 🚨
The material on this page does not constitute as financial advice and does not take into account your level of understanding, investment objectives, financial situation or any other particular needs.
All the information provided, including opinions, market research, mathematical results and technical analyses published on the website or transmitted to you by other means is provided for information purposes only and should in no event be interpreted as an offer of, or solicitation for, a transaction in any financial instrument, nor should the information provided be construed as advice of legal or fiscal nature.
Any investment decisions you make shall be based exclusively on your level of understanding, investment objectives, financial situation or any other particular needs. Any decision to act on information published on the website or transmitted to you by other means is entirely at your own risk. You are solely responsible for such decisions.
If you are in doubt or are not sure that you understand a particular product, instrument, service, or transaction, you should seek professional or legal advice before trading.
Investing in OTC Derivatives carries a high degree of risk, as they are leveraged based products and often small movements in the market could lead to much larger movements in the value of your investment and this could work against you or for you. Please ensure that you fully understand the risks involved, taking into account your investments objectives and level of experience, before trading, and if necessary, seek independent advice.
