-
Fundamental Shift: Gold has transitioned from a "fear trade" back to being driven by traditional market factors, specifically interest rate expectations and Treasury yields.
-
Institutional Bullishness: While speculators remain sidelined, ETFs have resumed buying, and major banks like JP Morgan target $6,000+ per ounce by year-end.
-
Geopolitical Catalyst: The status of the Strait of Hormuz is the critical wildcard—its reopening is essential for gold to sustainably hold above the $5,000 mark.
-
Fundamental Shift: Gold has transitioned from a "fear trade" back to being driven by traditional market factors, specifically interest rate expectations and Treasury yields.
-
Institutional Bullishness: While speculators remain sidelined, ETFs have resumed buying, and major banks like JP Morgan target $6,000+ per ounce by year-end.
-
Geopolitical Catalyst: The status of the Strait of Hormuz is the critical wildcard—its reopening is essential for gold to sustainably hold above the $5,000 mark.
Gold prices have undergone a dramatic rollercoaster in recent months. Since December 2025, the metal has traded almost entirely as an asset dependent on risk appetite. This dynamic shifted at the end of January, and gold has since struggled to regain its former luster. A subsequent decline, fueled by concerns over resurgent inflation, has resulted in gold being priced once again by market fundamentals rather than risk sentiment. Does this pivot offer hope for a return to higher price levels?
Gold’s decoupling from fundamentals since 2022
In early 2022, gold gains were primarily driven by acute geopolitical risk following the invasion of Ukraine. However, surging inflation and the subsequent cycle of interest rate hikes soon overshadowed risk factors. Despite this, gold found a local bottom in late 2022, embarking on an initial moderate recovery before entering a robust uptrend at the start of 2024.
Conversely, when gold is modeled against inflation-linked bonds (TIPS) or the S&P 500, the metal has seen virtually no real appreciation since 2024. This suggests that the price surge was driven by factors such as strong central bank demand, hedging against a potential second wave of inflation, and broader market risks later amplified by Donald Trump’s return to office.
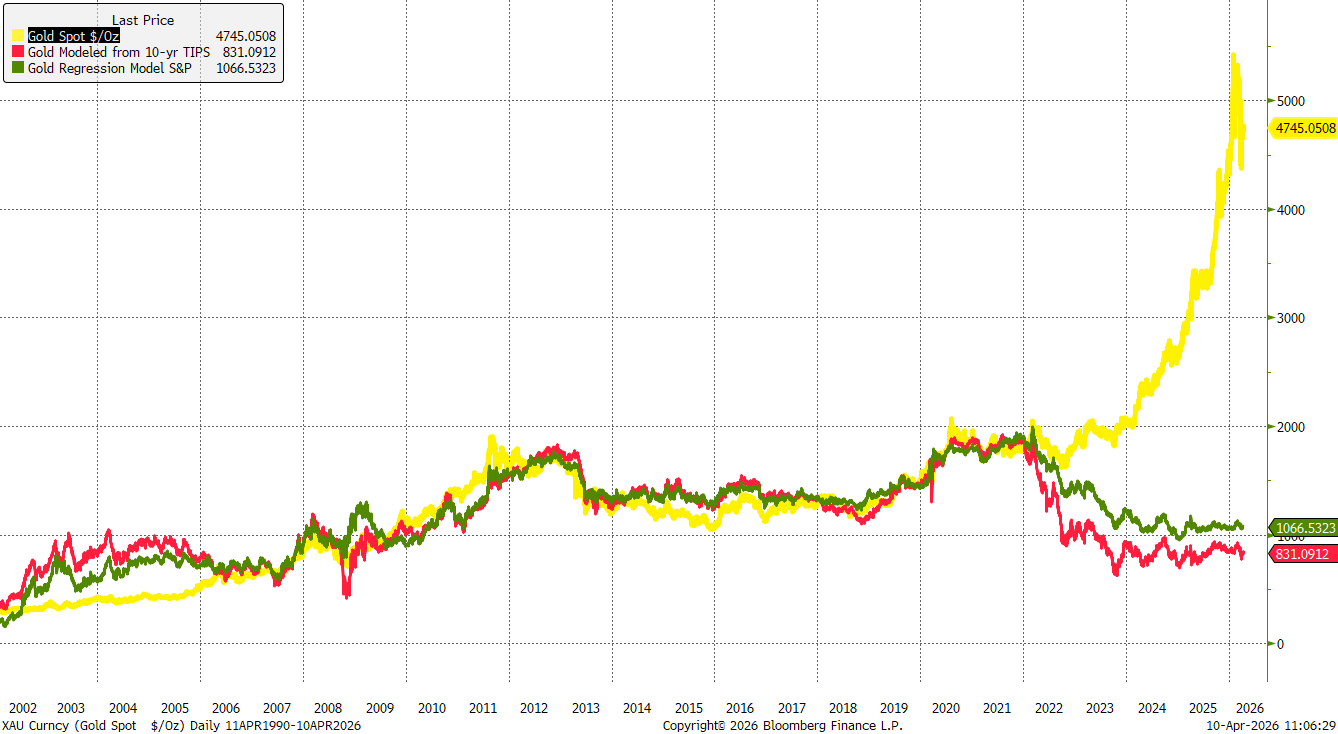 Gold has decoupled from standard market fundamentals since 2022. Source: Bloomberg Finance LP
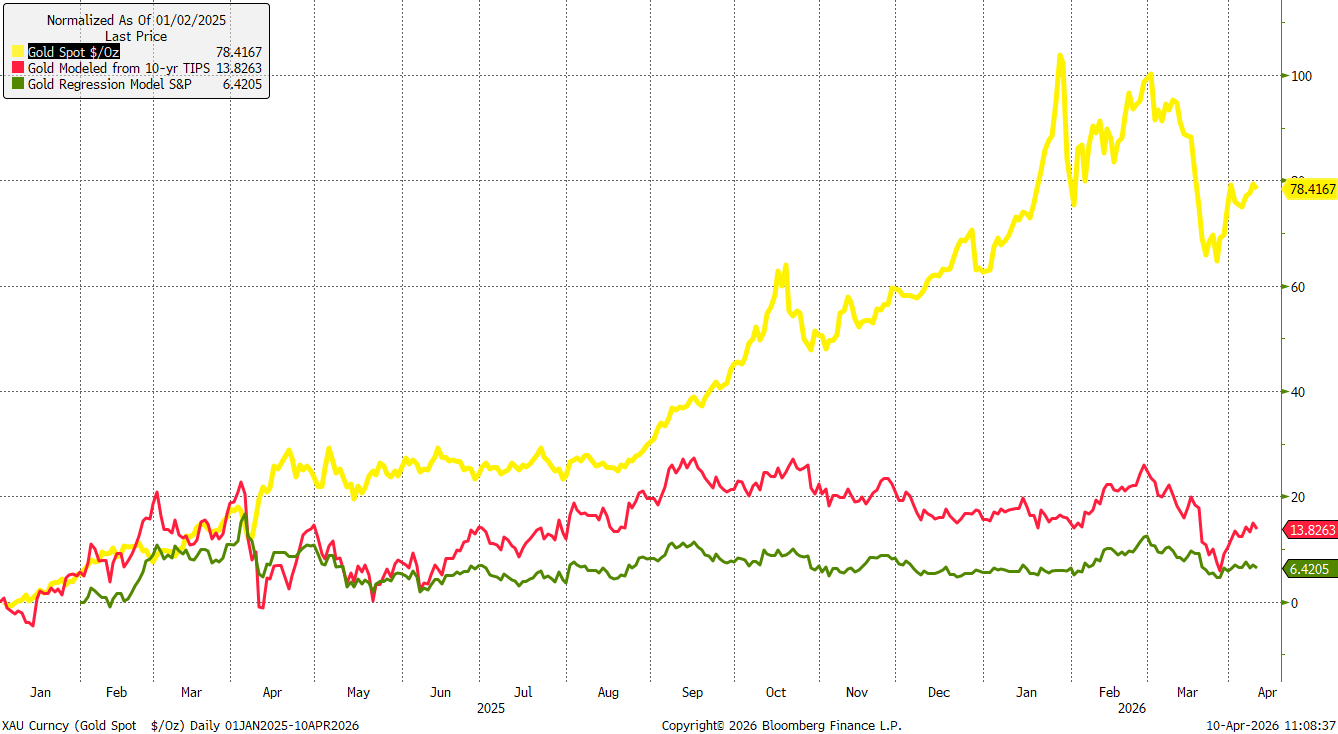 Gold has gained over 70% since the start of 2025, but when priced against the S&P 500 or inflation-linked bonds, these gains appear minimal. Source: Bloomberg Finance LP, XTB
ETFs return to the fray as speculators remain sidelined
For several months, exchange-traded funds (ETFs) were consistent buyers, significantly altering the fundamental balance. We observed only a few major sell-off waves from these funds: in April and May 2025, following the introduction of broad global tariffs by Donald Trump, and again in October and November 2025 during a period of heightened market volatility. Yet, this was merely the prelude to a larger rally that culminated at $5,500 per ounce.
Since early March 2026, ETFs have accelerated their gold divestment, driven by profit-taking and a tactical move toward cash. Notably, a significant number of hedge funds heavily increased their gold allocations in the fourth quarter of 2025, making their sharp exit in March the most likely culprit for recent price action.
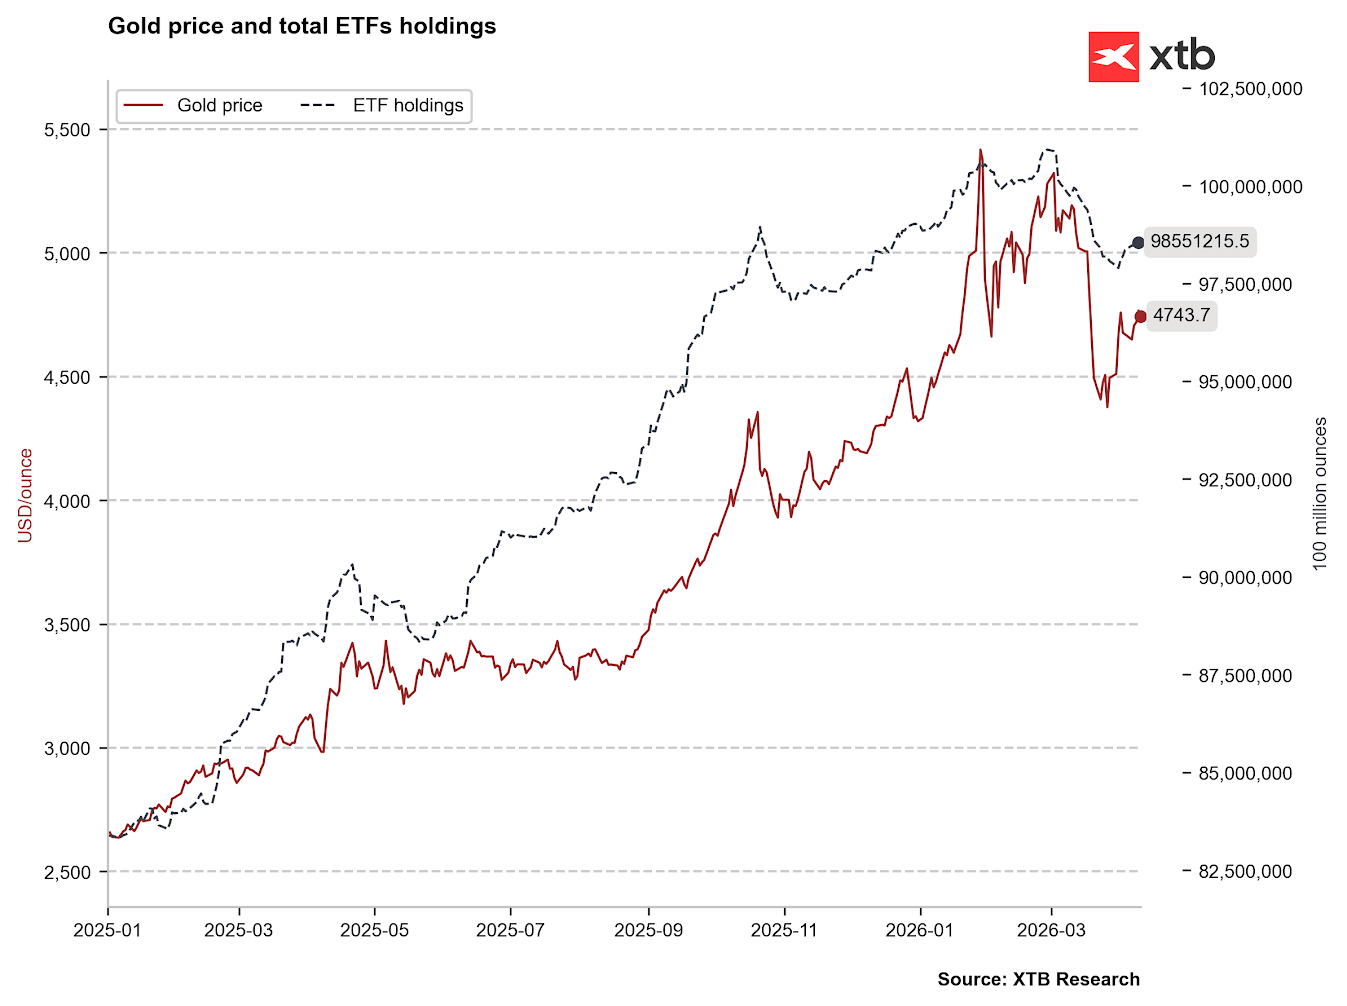 Following a sharp sell-off in March, we are seeing a return to gold buying by ETF funds. Source: Bloomberg Finance LP, XTB
While ETFs have resumed buying, speculative activity remains muted. Long positions on COMEX have fallen to their lowest levels since the 2023/2024 period, though net positions are not yet at extreme lows. Similarly, on the Shanghai Commodity Exchange, long positions have hit multi-year lows, with net positions only now bouncing off late-2025 troughs. These do not yet constitute strong bullish signals.
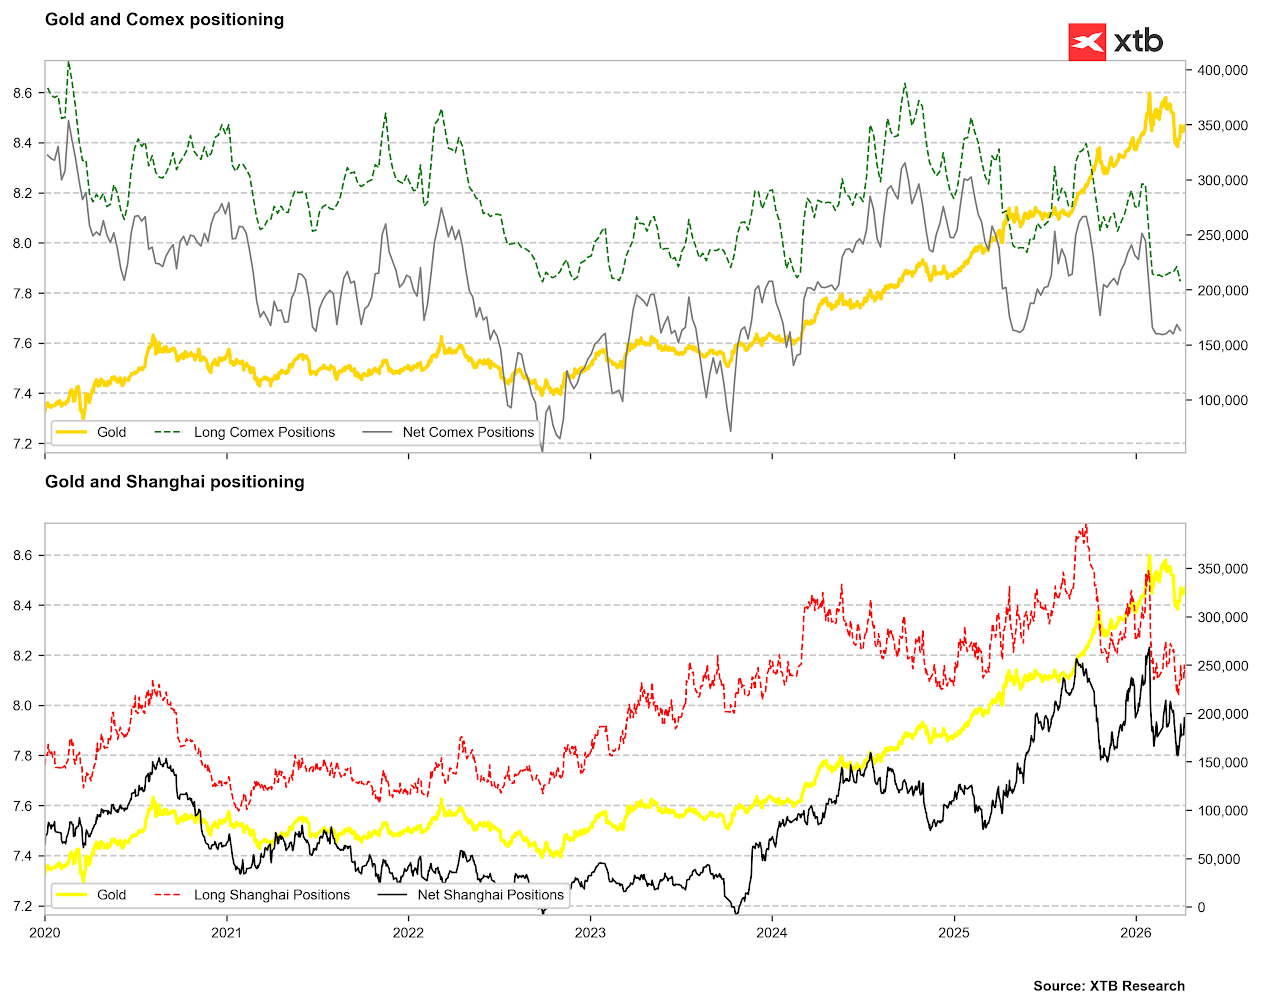 Speculators are providing no clear signal for gold. Source: Bloomberg Finance LP, XTB
Interest rates regain their primacy for bullion
While gold is traditionally viewed as an inflation hedge, this typically holds true over the long term during periods of moderate price growth. In the event of a sudden, sharp inflationary spike, gold often behaves like a risk asset due to a surge in demand for liquidity. Sharp inflation spikes usually herald a tighter monetary policy path.
This explains why gold began to falter as crude oil prices climbed above $100 per barrel, signaling a strong inflationary rebound and all but extinguishing hopes for rate cuts this year. For a time, markets even priced in a small probability of a US rate hike and continue to factor in potential tightening in the Eurozone and Japan.
In February, the market was still pricing in one or two rate cuts, with an effective rate of 3.0-3.2%. By late March, expectations shifted toward an effective rate of 3.8% for June, implying a potential hike. We are currently at 3.6%, suggesting stabilization. Nevertheless, a strong correlation between interest rate expectations and gold prices has emerged since early March—a link that was virtually non-existent prior to that.
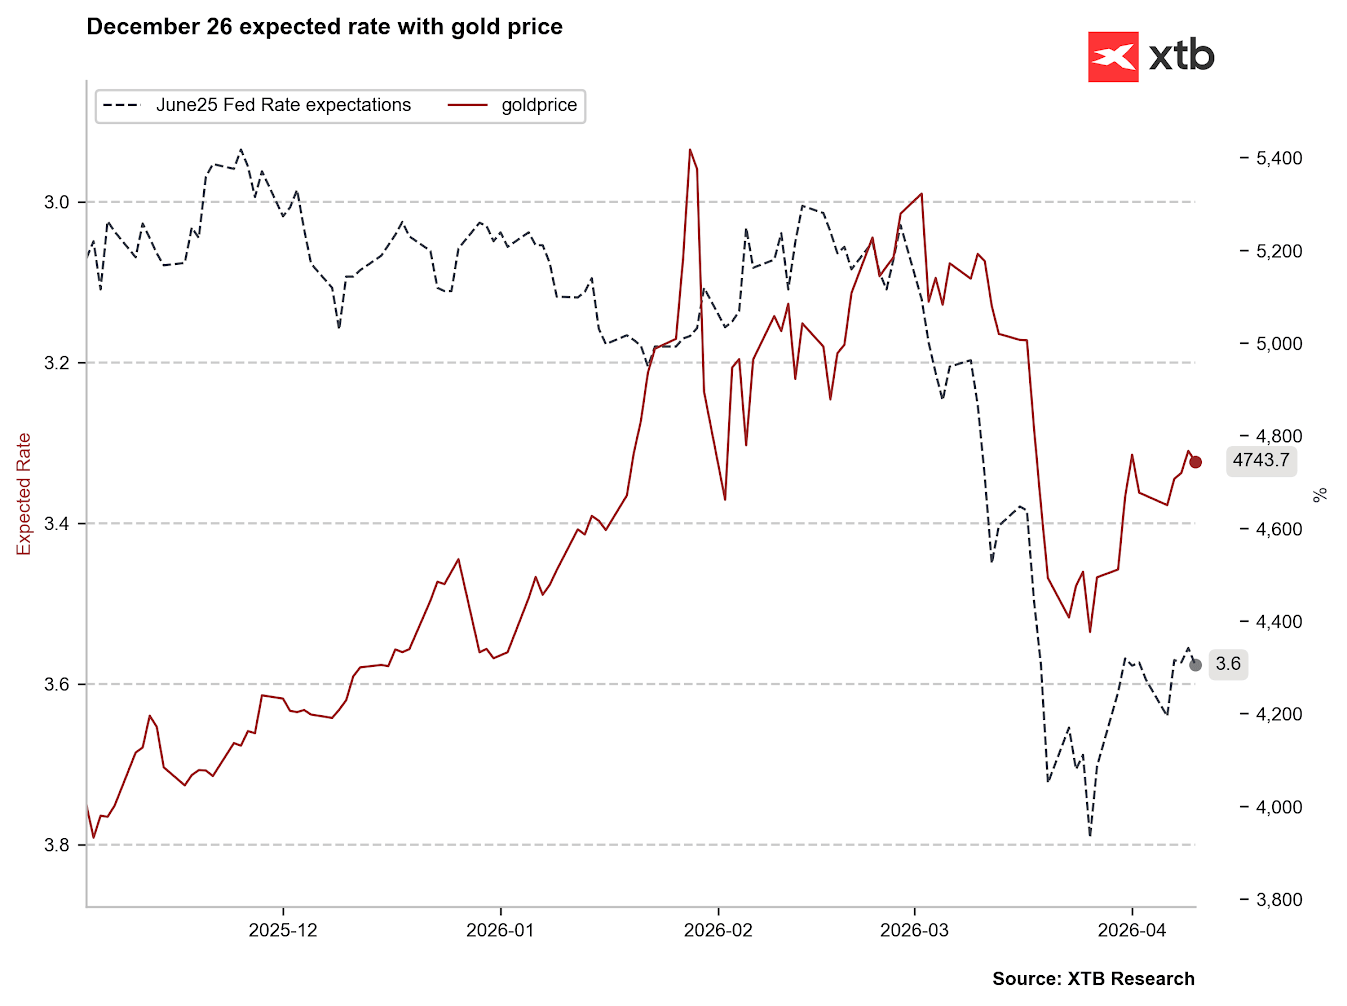 A significant correlation between expected interest rates and gold prices has been visible since early March. Source: Bloomberg Finance LP, XTB
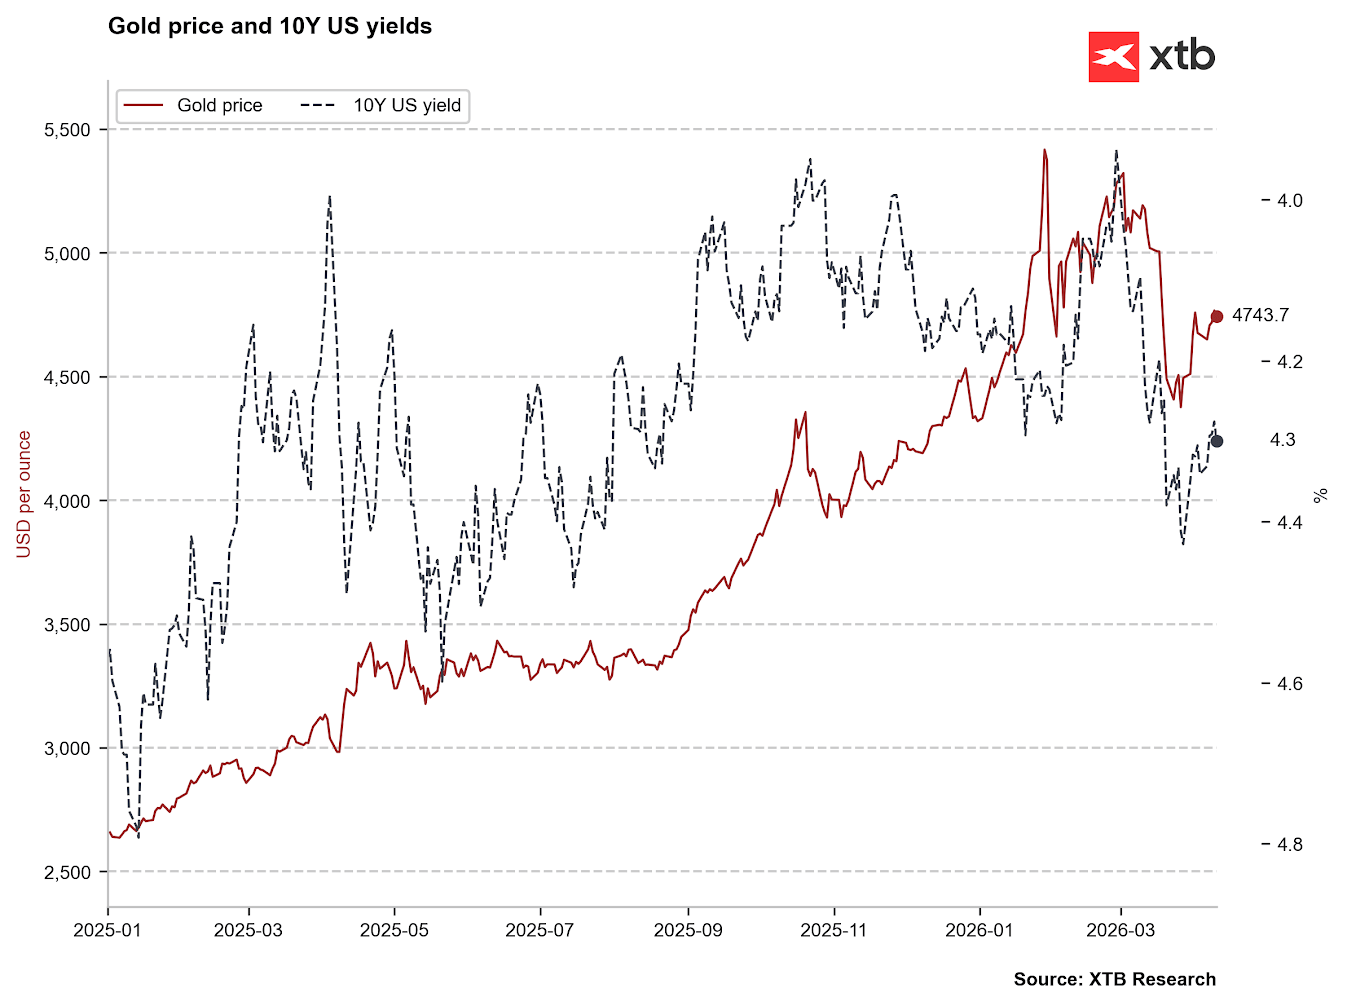 A stronger correlation is also evident with 10-year Treasury yields. If yields were to retreat toward 4.0%, there would be a chance for gold to trade once again significantly above $5,000. However, it is worth noting that beyond interest rates, sentiment regarding the sustainability of US debt plays a major role in yield movements. Source: Bloomberg Finance LP, XTB
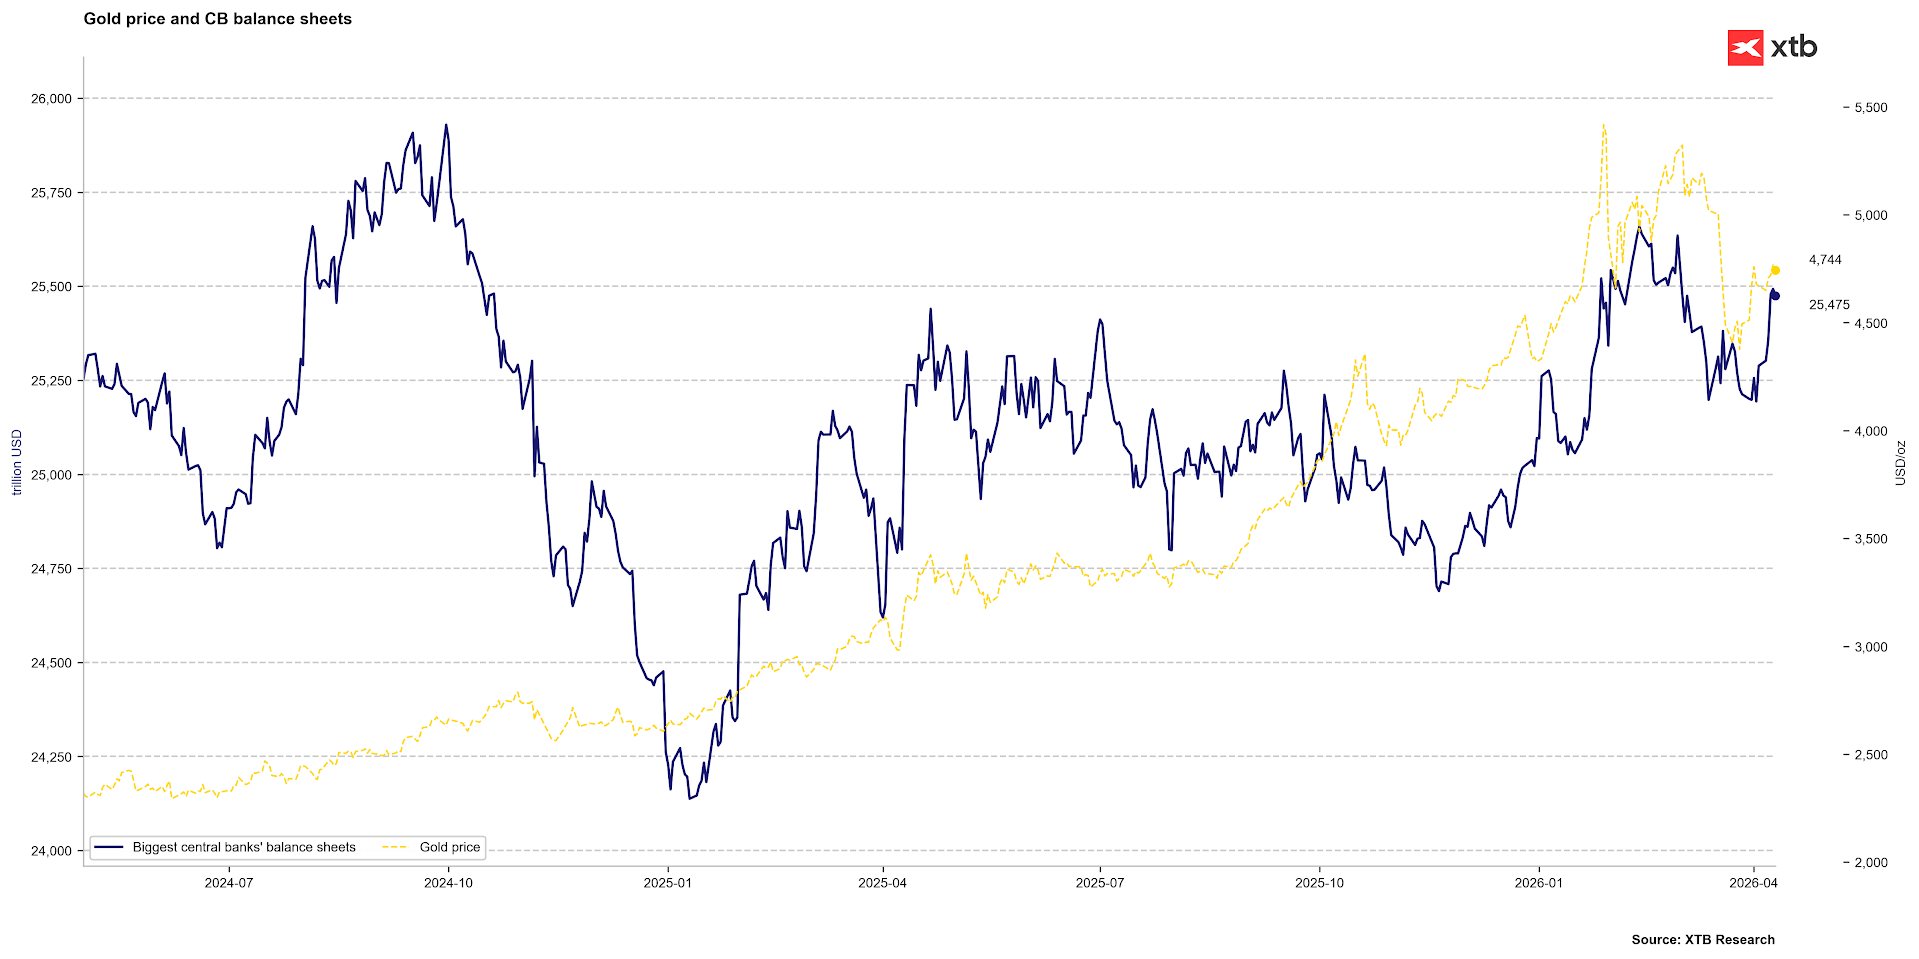 Another critical aspect for gold could be central bank interventions. If banks began expanding their balance sheets to suppress market rates, it would be a supportive factor for prices. However, for this to occur, inflation must not "de-anchor" from current expectations. While the chances of an inflationary shock on the scale of 2022 are low, persistently high fuel prices could alter this outlook within the coming weeks. Source: Bloomberg Finance LP, XTB
Seasonality suggests patience
Given the structural shifts in the gold market over the past eighteen months, seasonality may no longer be a deterministic factor. However, current market uncertainty warrants caution. Historical data suggests that sideways trends typically persist for 100 to 120 sessions a year. This implies that a definitive trend might not emerge until late May or June.
Looking at 5- and 10-year averages, as well as the period since the collapse of the Bretton Woods system, we see a robust uptrend in the first two months of the year. Long-term data shows that the second quarter does not typically differ significantly from the first, with a sideways trend becoming prominent around the 200-session mark. Beyond the first quarter, the strongest period of the year usually falls between the 120th and 200th sessions.
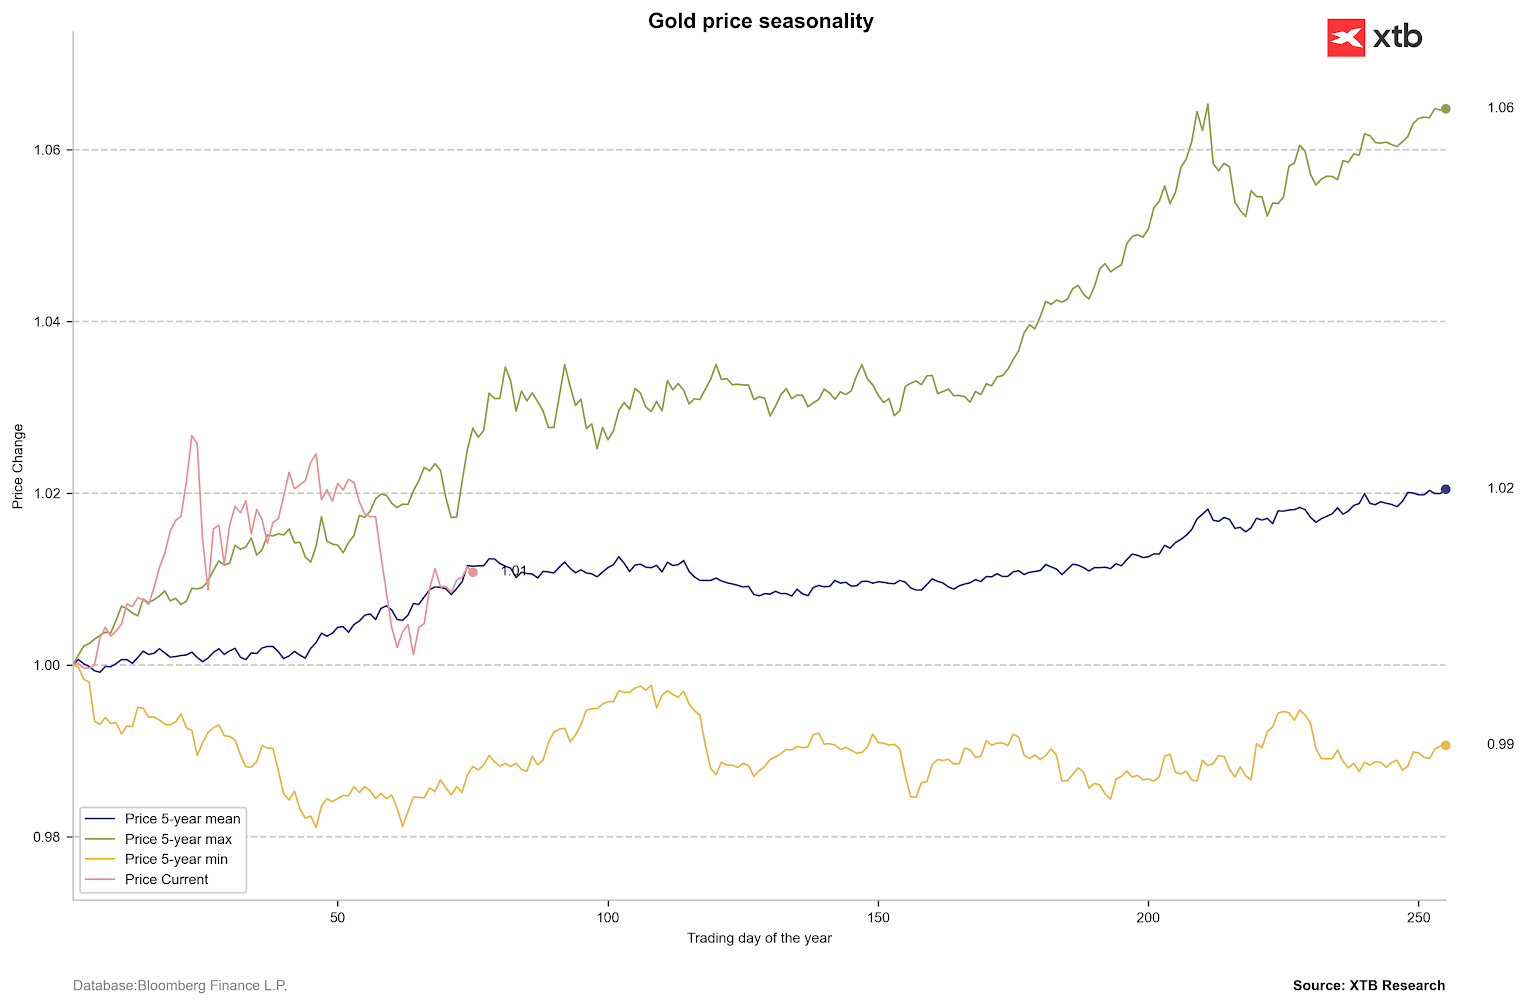 Price ranges for gold over the last 5 years. Source: Bloomberg Finance LP, XTB
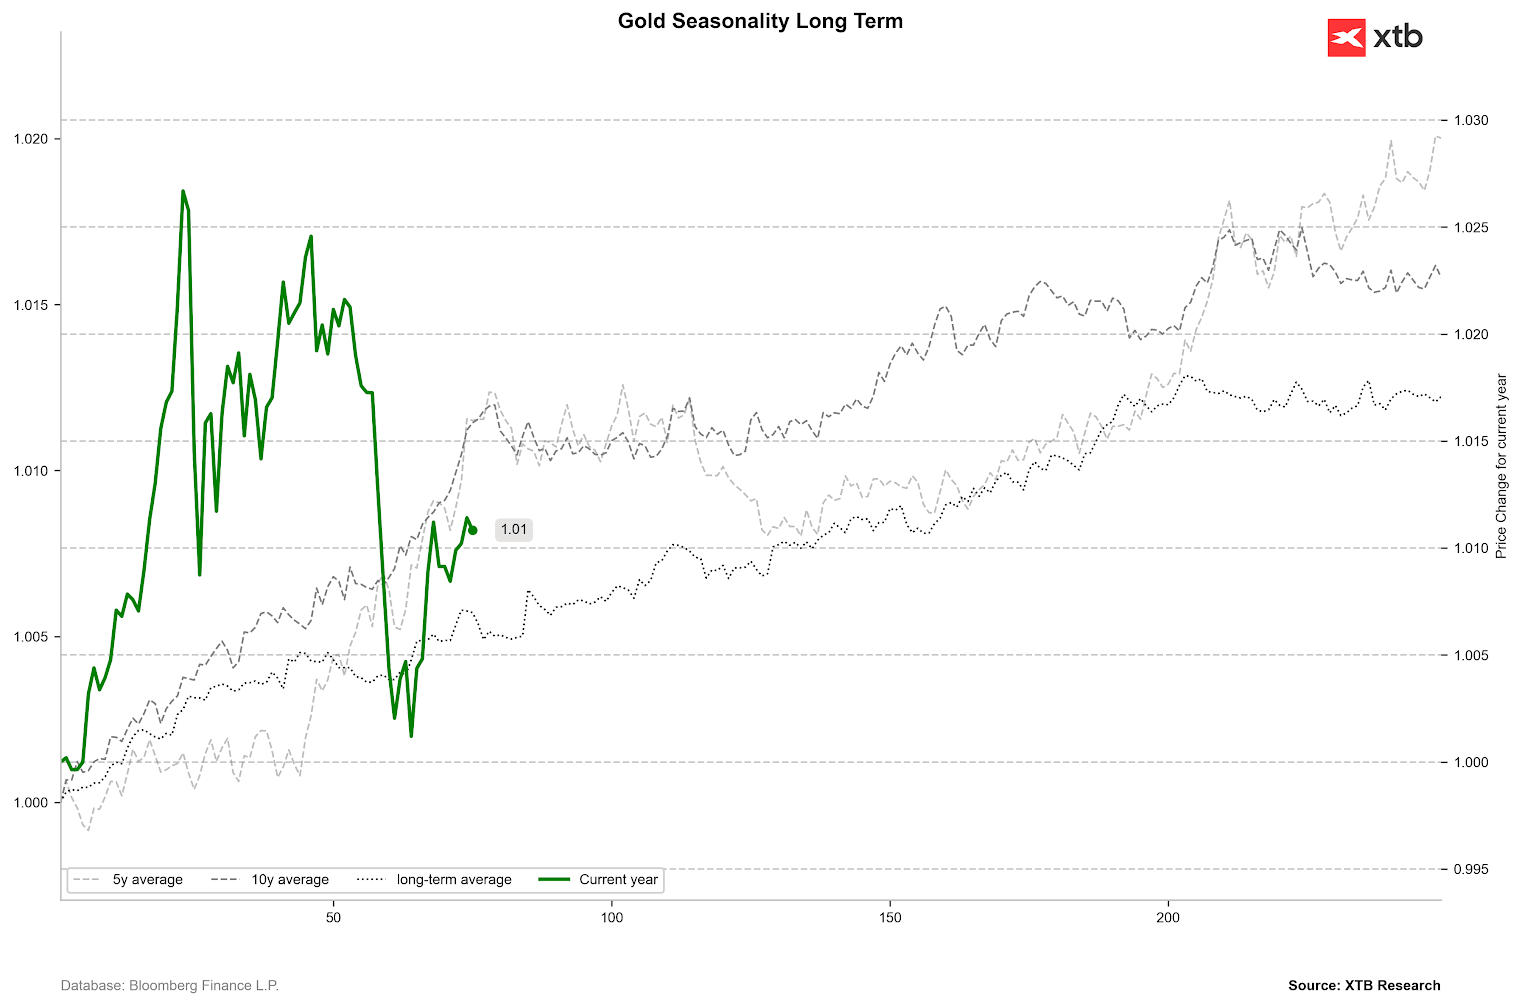 The strongest periods for gold prices are typically the first and third quarters. Source: Bloomberg Finance LP
What lies ahead for gold prices?
Expectations for gold remain cautiously optimistic. The median forecast sits at $4,650 per ounce—below recent highs, yet no major institution expects a drop below $4,000. A potential price peak is anticipated toward the end of this year, with markets expecting a cooling thereafter. Interestingly, even the most aggressive forecasts only see gold reaching $6,600 by the third quarter of 2027.
-
JP Morgan remains bullish, targeting $5,500 in Q2, $5,900 in Q3, and $6,300 in Q4 of this year. These projections reflect deep uncertainty regarding US debt levels.
-
Deutsche Bank is also optimistic, forecasting $6,000 per ounce by Q4 2026.
-
Goldman Sachs, long a gold bull, expects a modest breach of $5,000 in Q3.
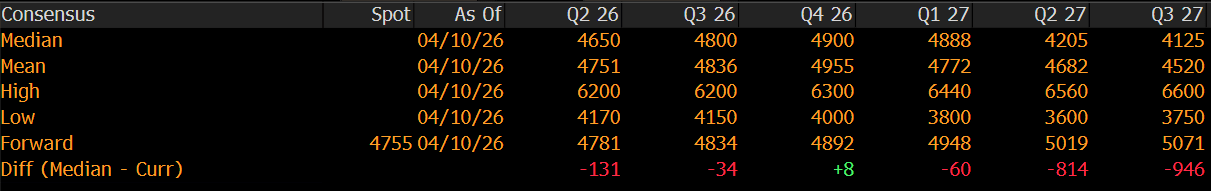 Forecasts for gold indicate moderate growth through the end of this year. Source: Bloomberg Finance LP
A critical variable for gold will be the rapid reopening of the Strait of Hormuz. Without it, a sustained inflationary shock could lead to higher rate expectations, which would be detrimental to gold and other precious metals. However, even if the market begins pricing in hikes, a local bottom could be reached by year-end, mirroring the price action of 2022.
Should the Strait of Hormuz reopen by late April, gold prices should return above $5,000 on a sustained basis, with a chance of hitting $6,000 by year-end due to US debt concerns and political uncertainty surrounding the mid-term elections. While the current bounce does not yet signal a new bull market—resembling instead a correction within a downtrend—breaching $5,000 could pivot the long-term narrative for the metal.
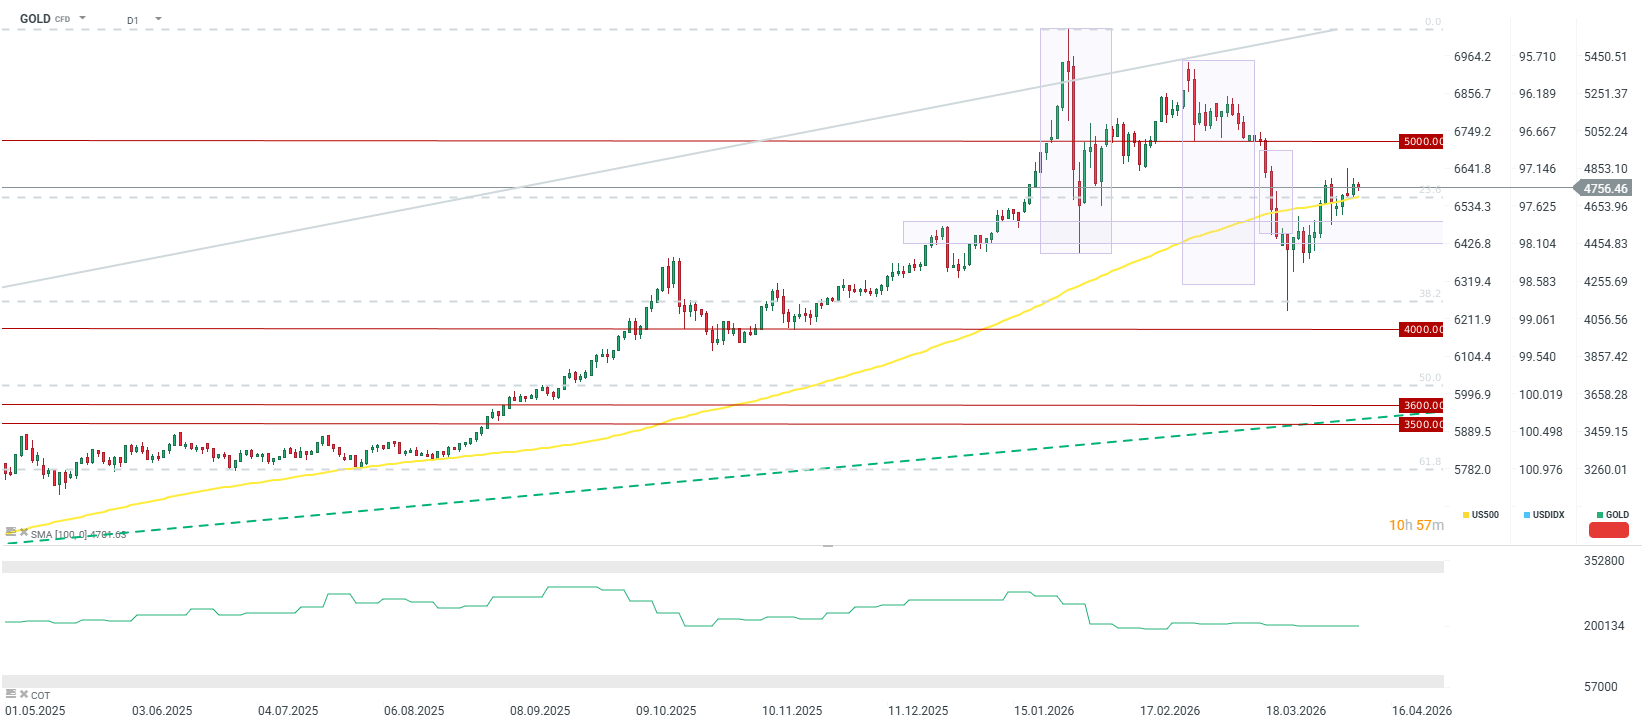
Source: xStation5

Chart of the Day: Is this a "real" breakthrough in the oil market this time? (12.06.2026)

Daily summary: “TACO Moment” supports indices rebound
US OPEN: A recovery after declines, Trump threatens to resume fighting with Iran

📆Will the ECB hike strengthen the euro?
The material on this page does not constitute as financial advice and does not take into account your level of understanding, investment objectives, financial situation or any other particular needs.
All the information provided, including opinions, market research, mathematical results and technical analyses published on the website or transmitted to you by other means is provided for information purposes only and should in no event be interpreted as an offer of, or solicitation for, a transaction in any financial instrument, nor should the information provided be construed as advice of legal or fiscal nature.
Any investment decisions you make shall be based exclusively on your level of understanding, investment objectives, financial situation or any other particular needs. Any decision to act on information published on the website or transmitted to you by other means is entirely at your own risk. You are solely responsible for such decisions.
If you are in doubt or are not sure that you understand a particular product, instrument, service, or transaction, you should seek professional or legal advice before trading.
Investing in OTC Derivatives carries a high degree of risk, as they are leveraged based products and often small movements in the market could lead to much larger movements in the value of your investment and this could work against you or for you. Please ensure that you fully understand the risks involved, taking into account your investments objectives and level of experience, before trading, and if necessary, seek independent advice.