
JPMorgan Chase kicked off the earnings season with a mixed signal, leaving the stock flat in the premarket trading (currently at around $325). The bank capped a record 2025 with its highest-ever annual revenue of $182 billion, despite a fourth-quarter profit hit from its strategic takeover of the Apple Card portfolio.
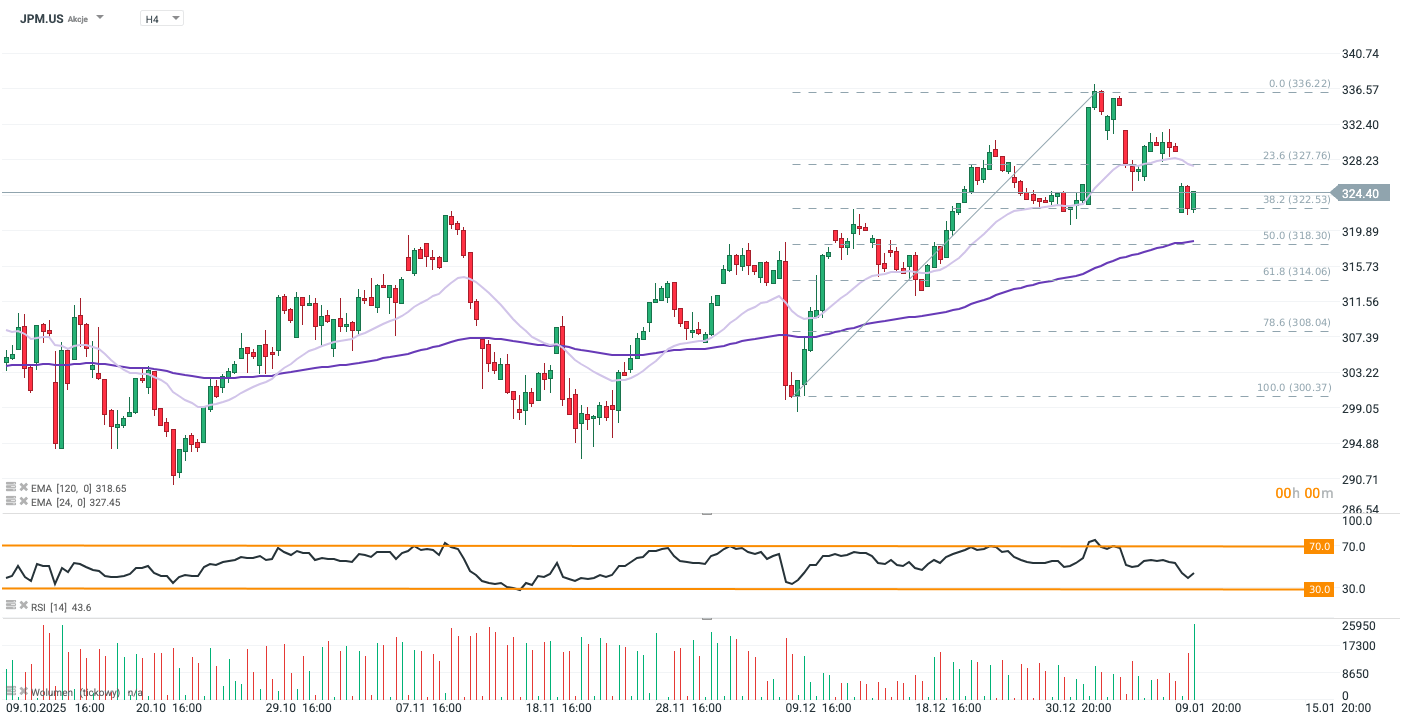
JPM stock has retreated to the 38.2% Fibonacci retracement level, weighed down by pre-earnings caution and President Trump’s recent comments on credit rate caps. The decline broke through immediate support around $330—a key level coinciding with the 30-day Exponential Moving Average (EMA30). This breach suggests that a quick return to recent highs is unlikely, potentially setting the stage for a deeper bearish test of the 100-day moving average (EMA100). Source: xStation5
Caution despite many beats
The bank reported Q4 net income of $13 billion, down 7% from the previous year. However, excluding the $2.2 billion provision for the Apple deal, EPS of $5.23 comfortably beat Wall Street's $4.85 forecast. (total EPS: $4.63). CEO Jamie Dimon cited a "resilient" economy but warned of "sticky inflation" and geopolitical hazards.
Shares initially rose 1% after volatility from President Trump’s proposed credit card rate caps, as the bank issued strong 2026 guidance projecting $95 billion in net interest income. Nevertheless, the overall EPS miss and premium-client-driven performance spark caution among investors, in spite of Jamie Dimon’s optimism regarding the U.S. economy, bringing stock’s premarket down to around 0.15-0.2%.
Top Line Results
-
Net Income: $13.03 billion, down 7% y/y.
-
EPS (Earnings Per Share): $4.63, down 4% y/y.
-
Note: EPS was $5.23 excluding significant items.
-
-
Adjusted Revenue: $46.77 billion vs. Estimate $46.35 billion. (BEAT)
-
Managed Net Interest Income: $25.11 billion (+7% y/y) vs. Estimate $24.99 billion. (BEAT)
Trading & Banking Highlights
-
Equities Sales & Trading: $2.86 billion (+40% y/y) vs. Estimate $2.7 billion. (BEAT)
-
FICC Sales & Trading: $5.38 billion (+7.5% y/y) vs. Estimate $5.27 billion. (BEAT)
-
Investment Banking Revenue: $2.55 billion (-1.9% y/y) vs. Estimate $2.65 billion. (MISS)
-
Note: Both Equity and Debt underwriting revenues missed estimates, with Equity underwriting down 16% y/y.
-
Credit & Balance Sheet
-
Provision for Credit Losses: $4.66 billion (includes Apple Card reserves) vs. Estimate $4.68 billion.
-
Net Charge-Offs: $2.51 billion vs. Estimate $2.56 billion. (BETTER THAN FEARED)
-
Assets Under Management: $4.79 trillion vs. Estimate $4.73 trillion.

Will Wall Street reach new record high?🗽Highlights from S&P 500 earnings season

Rallies in European airline valuations

US OPEN: The Strait of Hormuz is fully open 💥Euphoria in the markets 🚀

Market wrap: Peace rumours and disapointing earnings
The material on this page does not constitute as financial advice and does not take into account your level of understanding, investment objectives, financial situation or any other particular needs.
All the information provided, including opinions, market research, mathematical results and technical analyses published on the website or transmitted to you by other means is provided for information purposes only and should in no event be interpreted as an offer of, or solicitation for, a transaction in any financial instrument, nor should the information provided be construed as advice of legal or fiscal nature.
Any investment decisions you make shall be based exclusively on your level of understanding, investment objectives, financial situation or any other particular needs. Any decision to act on information published on the website or transmitted to you by other means is entirely at your own risk. You are solely responsible for such decisions.
If you are in doubt or are not sure that you understand a particular product, instrument, service, or transaction, you should seek professional or legal advice before trading.
Investing in OTC Derivatives carries a high degree of risk, as they are leveraged based products and often small movements in the market could lead to much larger movements in the value of your investment and this could work against you or for you. Please ensure that you fully understand the risks involved, taking into account your investments objectives and level of experience, before trading, and if necessary, seek independent advice.