
- What's next for the Ethereum price❓
- What's next for the Ethereum price❓
On the D1 chart, Ethereum prices clearly moved upwards during yesterday's session. The price managed to break through the key short-term resistance, i.e. the average of the last 100 periods, marked on the chart with a blue line. If the price remains above this average, a move towards resistance at $3,544 is possible, where the upper limit of the 1 to 1 geometry is located. Breaking through this level could pave the way for further gains. On the other hand, a rapid return of the price below the 100-period average could result in a renewed downward movement towards the support zone at $2,850.
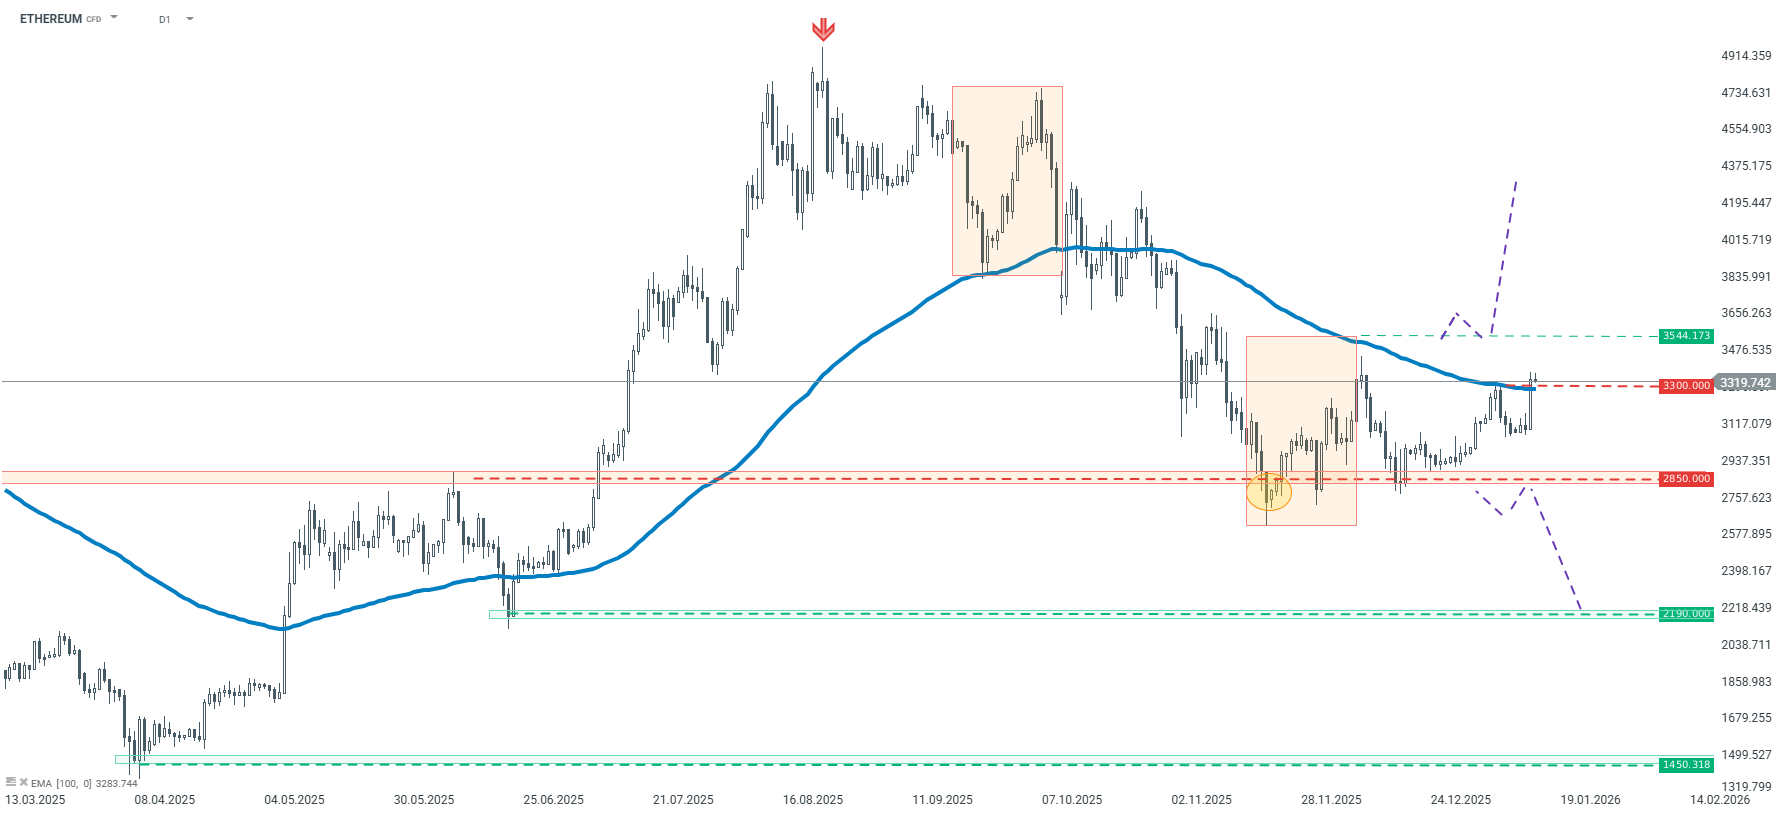
Ethereum – D1 interval | Source: xStation 5
On the lower H4 interval, in line with yesterday's analysis, the upward scenario began to materialise after rebounding from the support zone at $3,075. Despite the earlier breach of local geometry, the price managed to set a new high, which suggests a local upward trend since mid-December. For this to be negated, the price would have to return below $3,075, which is not the baseline scenario at this point.
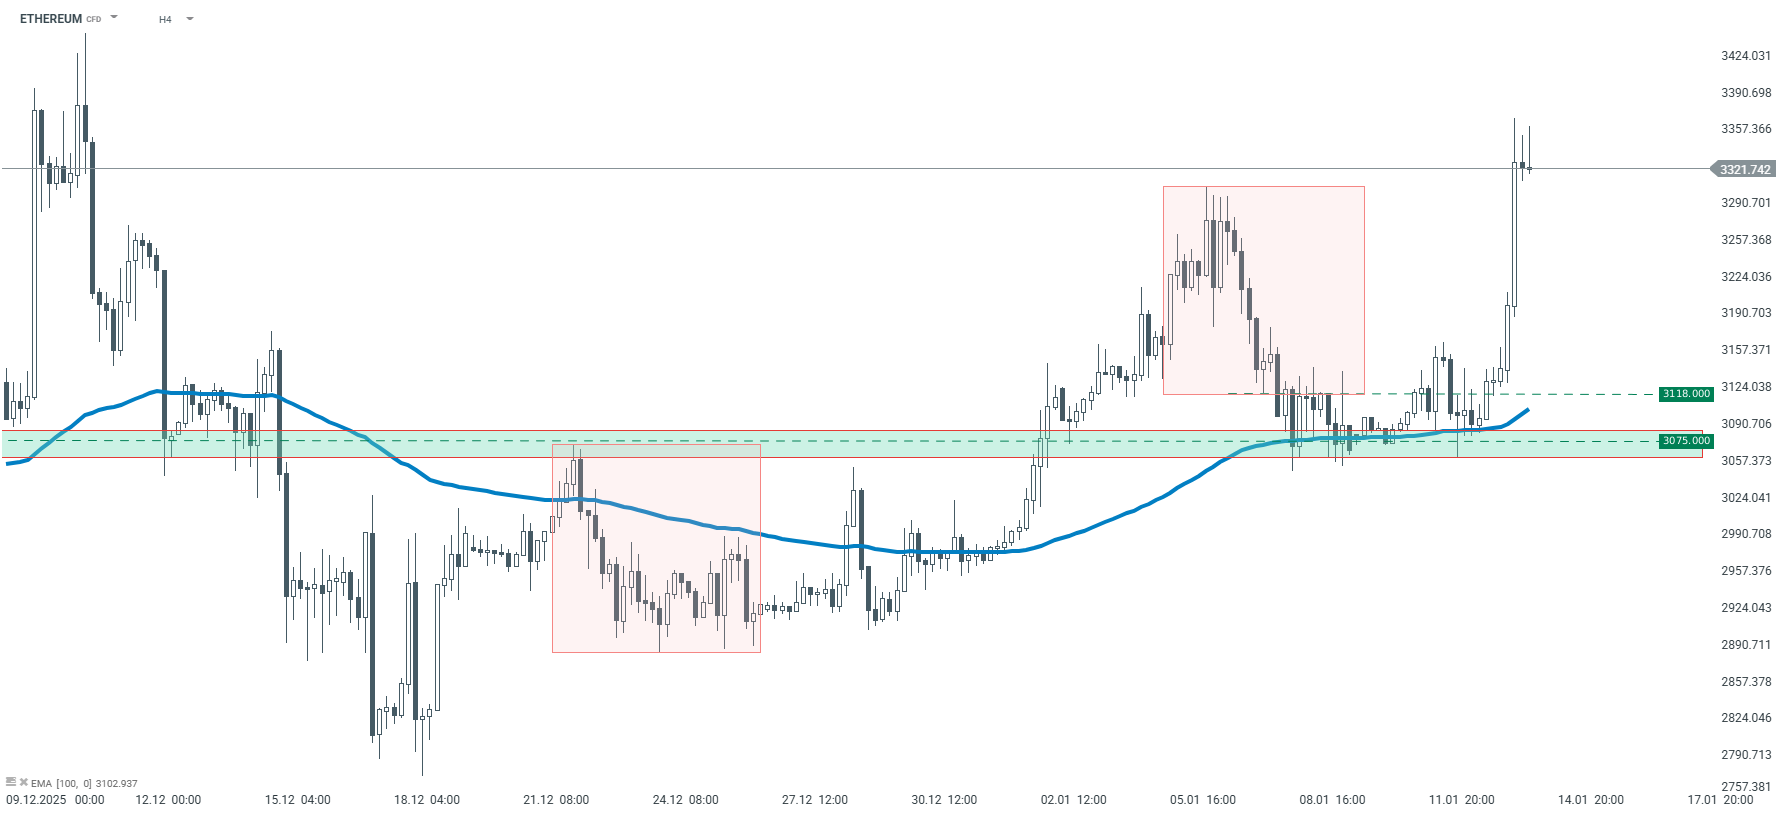
Ethereum – H4 interval | Source: xStation5

Daily Summary- Return of the Sell-off on Wall Street⬇️

🔴US100 drops nearly 4%

🟡⬇️Gold at its lowest since March

🛢️WTI Crude Below 90 USD Tests the 100-Session Average
The material on this page does not constitute as financial advice and does not take into account your level of understanding, investment objectives, financial situation or any other particular needs.
All the information provided, including opinions, market research, mathematical results and technical analyses published on the website or transmitted to you by other means is provided for information purposes only and should in no event be interpreted as an offer of, or solicitation for, a transaction in any financial instrument, nor should the information provided be construed as advice of legal or fiscal nature.
Any investment decisions you make shall be based exclusively on your level of understanding, investment objectives, financial situation or any other particular needs. Any decision to act on information published on the website or transmitted to you by other means is entirely at your own risk. You are solely responsible for such decisions.
If you are in doubt or are not sure that you understand a particular product, instrument, service, or transaction, you should seek professional or legal advice before trading.
Investing in OTC Derivatives carries a high degree of risk, as they are leveraged based products and often small movements in the market could lead to much larger movements in the value of your investment and this could work against you or for you. Please ensure that you fully understand the risks involved, taking into account your investments objectives and level of experience, before trading, and if necessary, seek independent advice.