
Markets are slightly muted during the final week of the year. Investors are still in Christmas moods and situation is expected to continue until New Year. However, decreased liquidity creates risk of larger, more rapid moves in the markets and it creates some trading opportunities. Take a look at our top 3 charts of the week - US100, DE30, ETHEREUM.
US100
Let’s start today’s analysis with the US tech index - Nasdaq (US100). Looking at the H4 interval, the price finally broke above the key resistance area at 16,440 pts,confirming the upward trend. According to the classic technical analysis, as long as the price sits above it, one should expect the continuation of upward move. The nearest resistance to watch is marked with all-time high near 16,765 pts. In case a correction occurs, one should also keep in mind that the aforementioned support is strengthened by the local 1:1 geometry and may provide support for buyers again.
 US100 H4 interval. Source: xStation5
DE30
Next let’s take a look at the German index - DAX (DE30), which realized the expected scenario. Looking at the D1 interval, one can see that the recent sell-off was stopped at the key mid-term support near 15,100 pts which was a result of previous price reactions and the large 1:1 structure. Following the rebound, the upward movement reached the resistance zone at 16,000 pts without any major difficulties. Future direction will depend on whether the zone will be broken or not. However, the long-term trend remains upward, so the probability of continuation seems higher.
 DE30 D1 interval. Source: xStation5
ETHEREUM
Last but not least, let's look at the cryptocurrency market. Looking at the ETHEREUM chart on the daily interval, one can see that the price pulled back from the key mid-term resistance at $4,050 which is a result of previous price reactions and lower limit of upward channel. Strong supply-side reaction to this resistance may argue for a deeper correction. In such a scenario, the nearest support to watch lies at $3,500, where one can find a lower limit of large 1:1 structure, as well as lows from 4th of December.
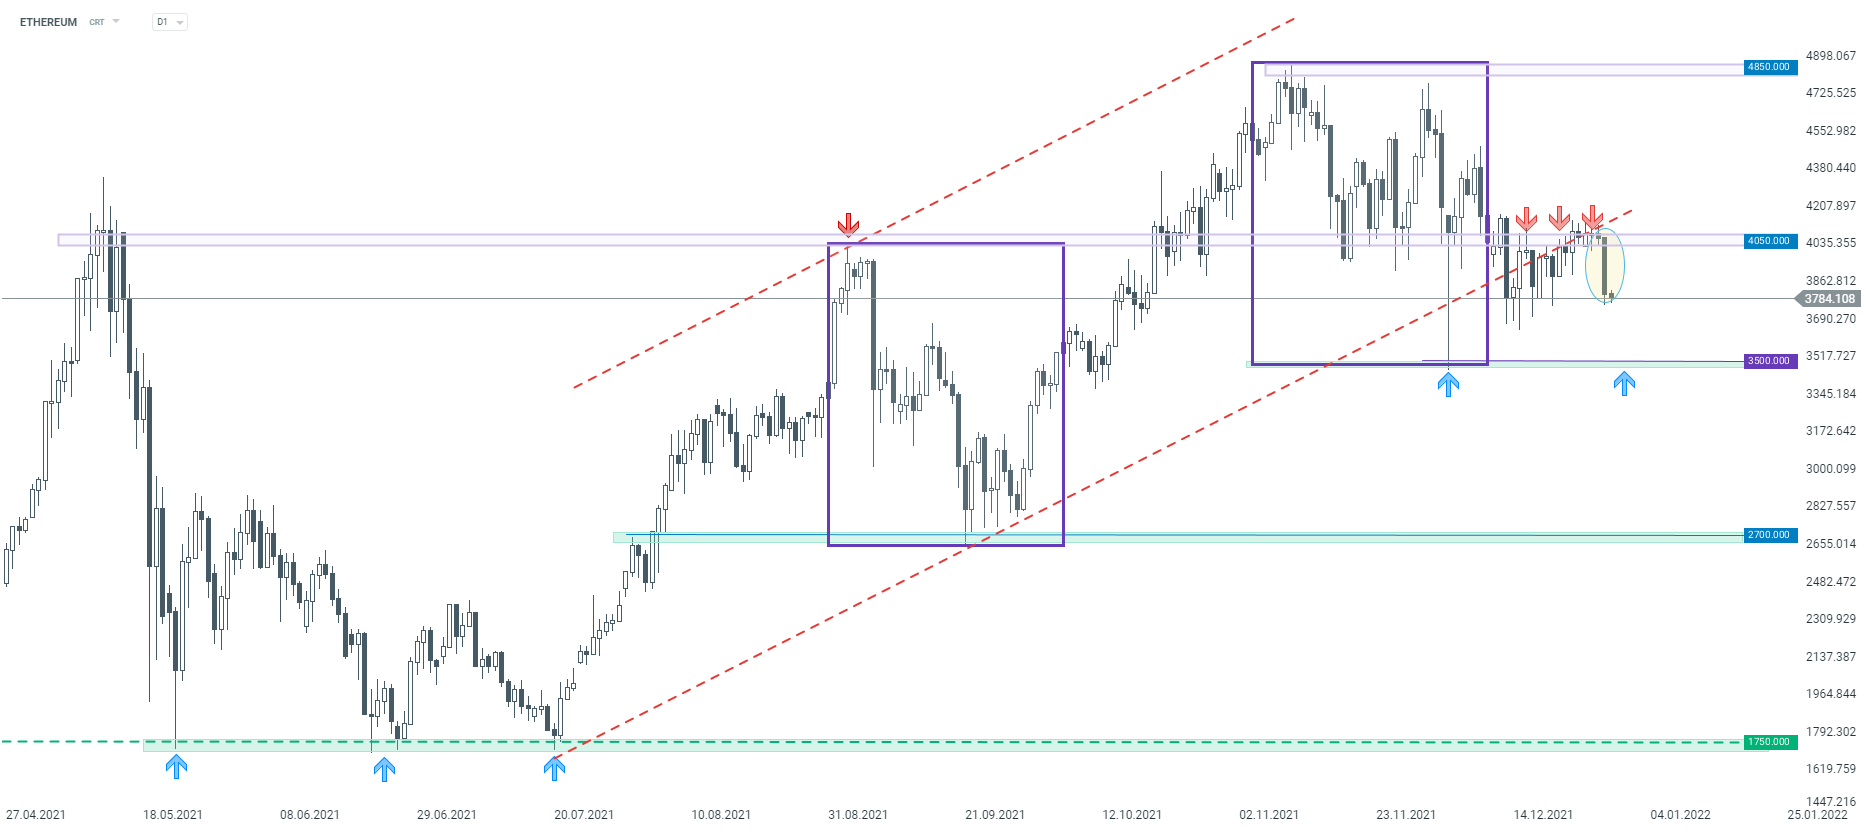 ETHEREUM D1 interval. Source: xStation5

Morning Wrap: Emotions Subside After the Truce. The Fed Takes Center Stage in the Markets

Daily Summary - Oil Nearly Erases War Gains as Wall Street Pulls Back Ahead of Fed Decision (16.06.2026)

⚫Brent Crude Oil Below $80!

Oil slips 3% 📉 Will the price fall below $80?
The material on this page does not constitute as financial advice and does not take into account your level of understanding, investment objectives, financial situation or any other particular needs.
All the information provided, including opinions, market research, mathematical results and technical analyses published on the website or transmitted to you by other means is provided for information purposes only and should in no event be interpreted as an offer of, or solicitation for, a transaction in any financial instrument, nor should the information provided be construed as advice of legal or fiscal nature.
Any investment decisions you make shall be based exclusively on your level of understanding, investment objectives, financial situation or any other particular needs. Any decision to act on information published on the website or transmitted to you by other means is entirely at your own risk. You are solely responsible for such decisions.
If you are in doubt or are not sure that you understand a particular product, instrument, service, or transaction, you should seek professional or legal advice before trading.
Investing in OTC Derivatives carries a high degree of risk, as they are leveraged based products and often small movements in the market could lead to much larger movements in the value of your investment and this could work against you or for you. Please ensure that you fully understand the risks involved, taking into account your investments objectives and level of experience, before trading, and if necessary, seek independent advice.