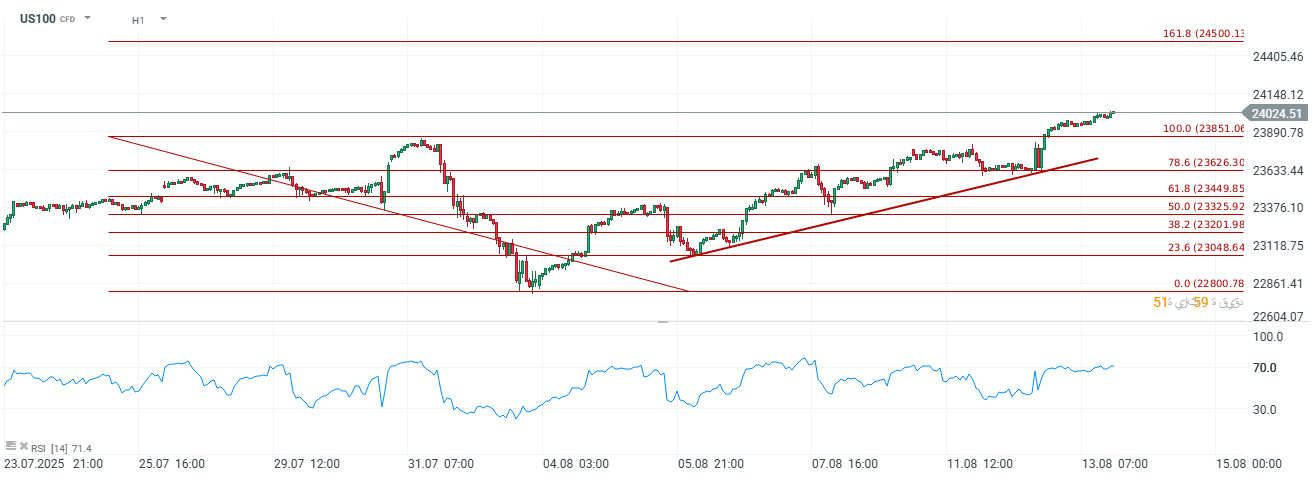
The US100 (Nasdaq) hourly chart (H1) shows strong bullish momentum, with the index extending its upward move and breaking through the key resistance level at 23,851 points (Fibonacci 100%). It is now trading above 24,020 points — its highest level in recent weeks.
Technical Analysis:
- After a corrective wave at the end of July, the index found strong support near 22,800 points (Fibonacci 0.0%) and rebounded sharply, forming a series of higher highs and higher lows. This indicates a clear uptrend supported by an ascending trendline that can be traced back to early August.
- Fibonacci levels highlight the importance of support at 23,352 points (50%), which acted as the launchpad for the latest bullish move. The recent breakout above 23,851 points suggests the potential for further upside, with 24,500 points (Fibonacci 161.8%) as the next area of interest.
- The Relative Strength Index (RSI) is at 71, indicating potential overbought conditions, which could lead to short-term profit-taking — though not necessarily a trend reversal.
Conclusion:
As long as the index holds above 23,850 points, the bullish scenario remains intact. However, technical indicators warn of a possible short-term correction. Traders will closely watch price behavior in the 24,000–24,100 range to assess whether the uptrend will continue or face a pullback toward 23,630 or 23,350 points.

Source: Xstation

US OPEN: Blowout Payrolls Signal Slower Path for Rate Cuts?

BREAKING: US100 jumps amid stronger than expected US NFP report

Market wrap: Oil gains amid US - Iran tensions 📈 European indices muted before US NFP report

📈 Gold jumps 1.5% ahead of NFP, hitting its highest level since Jan. 30
The material on this page does not constitute as financial advice and does not take into account your level of understanding, investment objectives, financial situation or any other particular needs.
All the information provided, including opinions, market research, mathematical results and technical analyses published on the website or transmitted to you by other means is provided for information purposes only and should in no event be interpreted as an offer of, or solicitation for, a transaction in any financial instrument, nor should the information provided be construed as advice of legal or fiscal nature.
Any investment decisions you make shall be based exclusively on your level of understanding, investment objectives, financial situation or any other particular needs. Any decision to act on information published on the website or transmitted to you by other means is entirely at your own risk. You are solely responsible for such decisions.
If you are in doubt or are not sure that you understand a particular product, instrument, service, or transaction, you should seek professional or legal advice before trading.
Investing in OTC Derivatives carries a high degree of risk, as they are leveraged based products and often small movements in the market could lead to much larger movements in the value of your investment and this could work against you or for you. Please ensure that you fully understand the risks involved, taking into account your investments objectives and level of experience, before trading, and if necessary, seek independent advice.


