



The current US earnings season continues to exceed even the most optimistic expectations. S&P 500 companies are now expected to deliver earnings growth of 47.4% year-over-year for the second quarter, up from roughly 23% expected at the end of June. If realized, this would mark the strongest quarterly earnings growth since Q4 2021, when profits surged by more than 91% year-over-year. Excluding Alphabet and Amazon, expected earnings growth for the S&P 500 would still stand at an impressive 28.8% year-over-year, the strongest reading in five years.
Most companies are not only beating Wall Street estimates but are also prompting analysts to raise profit forecasts for the broader S&P 500. According to FactSet data as of July 31, 86% of S&P 500 companies have reported earnings per share above expectations, while 77% exceeded revenue forecasts. Nine of the eleven sectors have seen upward earnings revisions thanks to stronger-than-expected results and higher EPS estimates.
Looking ahead to the third quarter, 34 companies have raised earnings guidance, while only 20 have issued negative outlooks. Meanwhile, the S&P 500 currently trades at a forward P/E ratio of 19.6, below its five-year average of 19.9 and only slightly above its 10-year average of 19.0. Considering improving corporate margins, the strong earnings backdrop, and the index trading at record highs, current valuations do not appear particularly stretched.
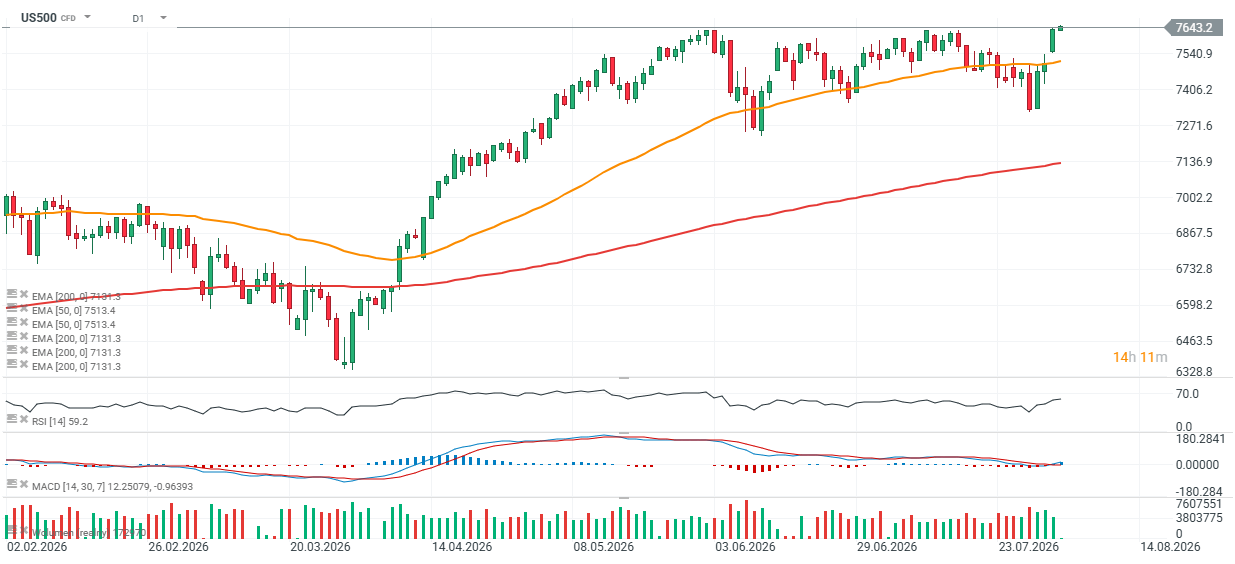
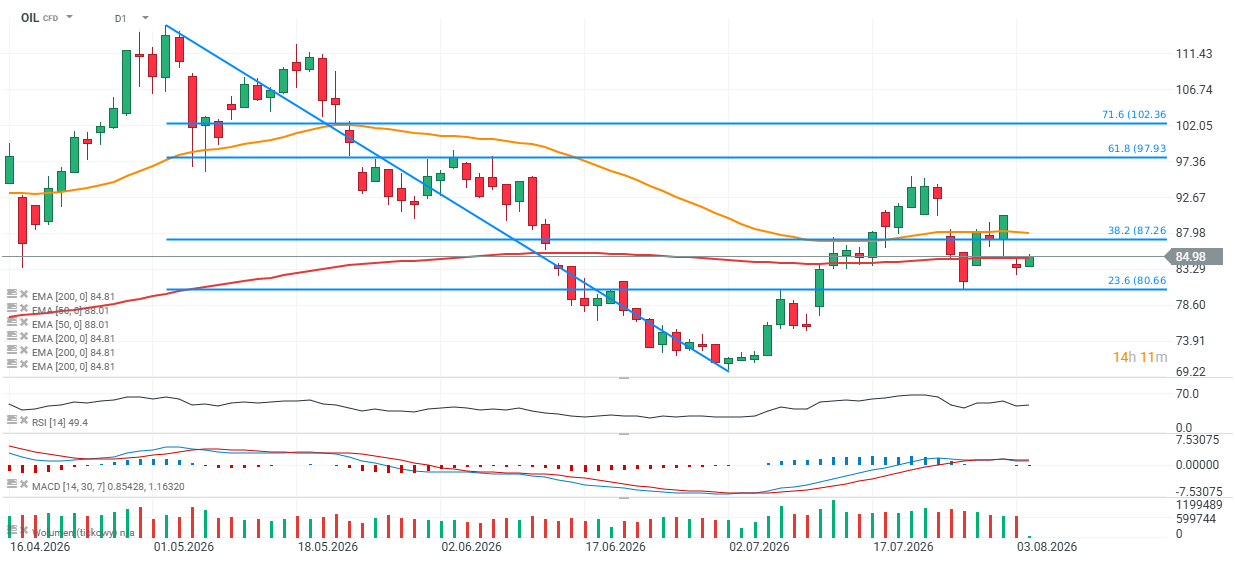
US500 and OIL charts (D1)
The US500 contract has recently rebounded twice after briefly falling below the 50-day EMA (orange line), highlighting the importance of the 7,200–7,300 point area as a key support zone for buyers. The index is now trading at an all-time high, while the RSI remains just below 60, suggesting there is still room for further upside. Key support levels are located near 7,500 and 7,300 points, where the market has previously seen significant buying interest.
Source: xStation5
Brent crude oil (OIL) has pulled back sharply from its recent local high near $94 per barrel and failed to break above the 61.8% Fibonacci retracement of the latest downward move. The next major support lies around $80 per barrel, defined by the 23.6% Fibonacci retracement and previous price reaction levels.
Source: xStation5



Three Markets to Watch Next Week (04.09.2026)

Will NFP force the Fed to hike rates?


Economic Calendar - Key NFP Report Takes Center Stage


Morning Wrap: Can NFP Confirm Waller’s Dovish Turn?
The material on this page does not constitute as financial advice and does not take into account your level of understanding, investment objectives, financial situation or any other particular needs.
All the information provided, including opinions, market research, mathematical results and technical analyses published on the website or transmitted to you by other means is provided for information purposes only and should in no event be interpreted as an offer of, or solicitation for, a transaction in any financial instrument, nor should the information provided be construed as advice of legal or fiscal nature.
Any investment decisions you make shall be based exclusively on your level of understanding, investment objectives, financial situation or any other particular needs. Any decision to act on information published on the website or transmitted to you by other means is entirely at your own risk. You are solely responsible for such decisions.
If you are in doubt or are not sure that you understand a particular product, instrument, service, or transaction, you should seek professional or legal advice before trading.
Investing in OTC Derivatives carries a high degree of risk, as they are leveraged based products and often small movements in the market could lead to much larger movements in the value of your investment and this could work against you or for you. Please ensure that you fully understand the risks involved, taking into account your investments objectives and level of experience, before trading, and if necessary, seek independent advice.
