
Bitcoin has pulled back to around $66,000 and in recent days has failed to recover its losses, despite a rebound attempt in equity indices. Cryptocurrencies are being weighed down by a strong US dollar and a surge in US Treasury yields, which is draining liquidity from risk assets.
- BTC fell from around $76,000 in March to $66,000, marking a decline of approximately 15%. The improvement in spot market activity and a cautious (positive) inflow into ETFs did not provide sufficient support.
- Following the drop from around $94,000 in January, the $74,000–$76,000 zone has already twice acted as resistance, and this area continues to serve as the main technical barrier.
- At the same time, Bitcoin has twice reacted with declines near the 38.2% Fibonacci retracement of the recent downward impulse, which is located around $74,000.
- Currently, the price is trading in the lower range of an ascending price channel, with higher lows still being formed. A break below $66,000 could signal significant weakness and increased selling pressure—a downside breakout.
- The current pattern resembles a flag formation, which is typically a trend continuation pattern—in this case, suggesting continuation of the downward trend.
A drop toward $65,000 could potentially open the way for a deeper selling impulse, while a move back above $70,000 (the first psychological resistance level, further reinforced by price action) could pave the way toward $74,000 and a possible upside breakout from the ascending channel, which would require a move above the $77,000–$78,000 area.
Bitcoin (H1 timeframe)
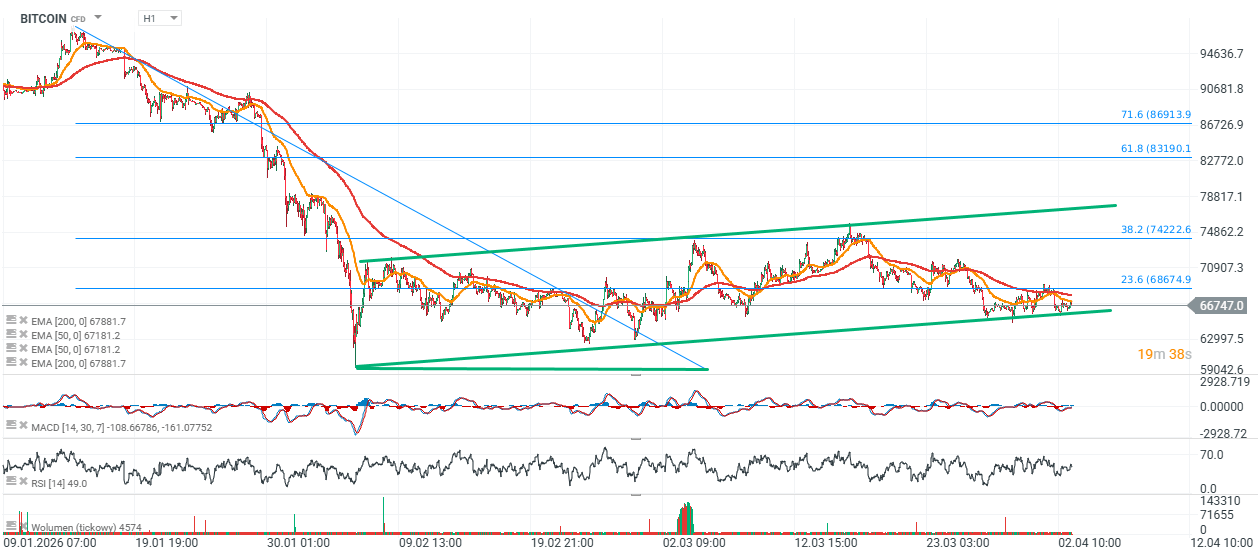
Source: xStation5

Daily summary: Wall Street climbs higher as oil falls 📈 SpaceX surges 28%

Oil slides 2.5% to $88 as Middle East tensions ease 📉 Is the uptrend over?

Wall Street Rebounds as Oil Prices Fall 📈 Adobe Shares Drop 8% After Earnings

BREAKING: USDIDX decline despite strong University of Michigan data
The material on this page does not constitute as financial advice and does not take into account your level of understanding, investment objectives, financial situation or any other particular needs.
All the information provided, including opinions, market research, mathematical results and technical analyses published on the website or transmitted to you by other means is provided for information purposes only and should in no event be interpreted as an offer of, or solicitation for, a transaction in any financial instrument, nor should the information provided be construed as advice of legal or fiscal nature.
Any investment decisions you make shall be based exclusively on your level of understanding, investment objectives, financial situation or any other particular needs. Any decision to act on information published on the website or transmitted to you by other means is entirely at your own risk. You are solely responsible for such decisions.
If you are in doubt or are not sure that you understand a particular product, instrument, service, or transaction, you should seek professional or legal advice before trading.
Investing in OTC Derivatives carries a high degree of risk, as they are leveraged based products and often small movements in the market could lead to much larger movements in the value of your investment and this could work against you or for you. Please ensure that you fully understand the risks involved, taking into account your investments objectives and level of experience, before trading, and if necessary, seek independent advice.