
US500 is facing challenges. Futures based on the popular S&P500 index are extending their decline for the third consecutive week and are currently trading around the 100-day exponential moving average. This level may serve as a key support level that will determine whether the bulls can recover or if a deeper correction is in store. With the current closing price of yesterday's session, the world's most important index has retraced 5% from its all-time highs. However, considering the current futures prices, today's declines would bring that figure closer to 6%.
Today, the weakness in the market is primarily driven by the armed conflict in the Middle East, where Israel responded forcefully to recent missile attacks by Iran. The second factor contributing to the market weakness was the reaction to Netflix's quarterly results. The company's stock lost 4% after the close of Wall Street because the management plans to stop disclosing data on new subscription growth from 2025. This has put pressure on the company, despite its strong financial results.
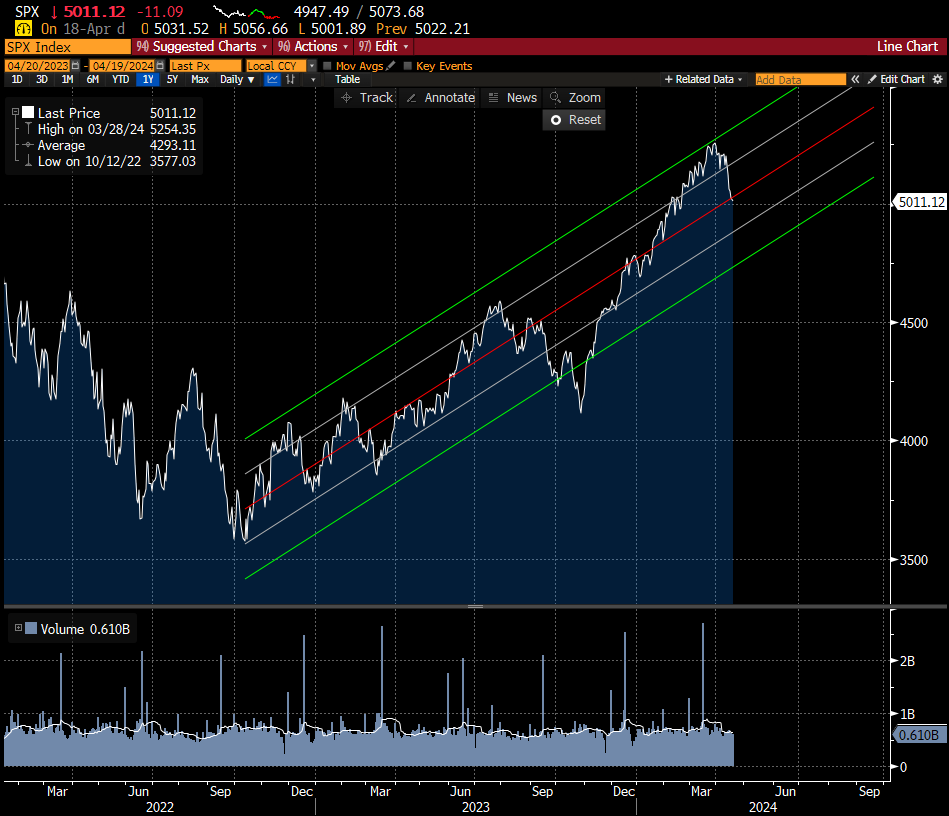
Analyzing the dynamics of the bull market that started in October 2022 and applying regression analysis to it, we can observe that the index is currently within the range of the average values defined by this channel. Source: Bloomberg Financial LP
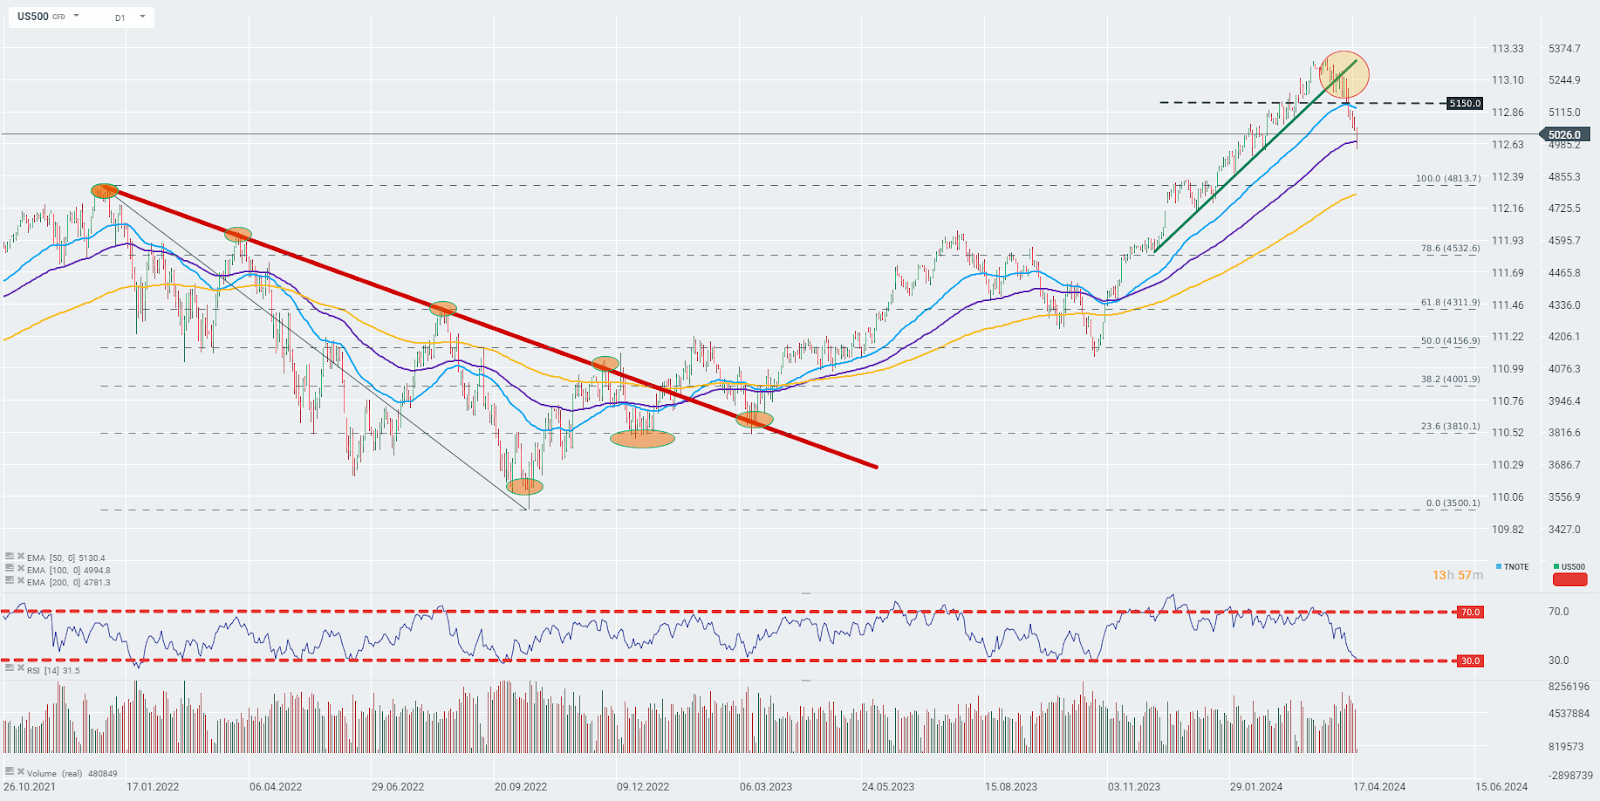
The US500 benchmark is currently trading around the 100-day EMA zone (purple line). The significance of this zone, considering the medium-term trends observed on this index, may be crucial for analyzing potential further market behavior. The key resistance level, in case the indices erase part of the declines, could be around the 50-day EMA zone (blue line). However, a stronger downward breakout could open the way for further declines towards the 200-day EMA zone (gold line). Source: xStation

Daily Summary - Powerful NFP report could delay Fed rate cuts

US OPEN: Blowout Payrolls Signal Slower Path for Rate Cuts?

BREAKING: US100 jumps amid stronger than expected US NFP report

Market wrap: Oil gains amid US - Iran tensions 📈 European indices muted before US NFP report
The material on this page does not constitute as financial advice and does not take into account your level of understanding, investment objectives, financial situation or any other particular needs.
All the information provided, including opinions, market research, mathematical results and technical analyses published on the website or transmitted to you by other means is provided for information purposes only and should in no event be interpreted as an offer of, or solicitation for, a transaction in any financial instrument, nor should the information provided be construed as advice of legal or fiscal nature.
Any investment decisions you make shall be based exclusively on your level of understanding, investment objectives, financial situation or any other particular needs. Any decision to act on information published on the website or transmitted to you by other means is entirely at your own risk. You are solely responsible for such decisions.
If you are in doubt or are not sure that you understand a particular product, instrument, service, or transaction, you should seek professional or legal advice before trading.
Investing in OTC Derivatives carries a high degree of risk, as they are leveraged based products and often small movements in the market could lead to much larger movements in the value of your investment and this could work against you or for you. Please ensure that you fully understand the risks involved, taking into account your investments objectives and level of experience, before trading, and if necessary, seek independent advice.