
Bitcoin hovers around $115,000, holding on to recent gains as the week begins. The sentiment weakened slightly after Nasdaq and S&P 500 futures dipped on reports of an antitrust investigation into Nvidia. Ethereum is down more than 2.5%, falling to $4,500.
-
The U.S. dollar is weakening, but this has not translated into crypto gains on Monday.
-
The Fed is almost certain to cut rates by 25 bps on Wednesday.
-
Crypto sentiment remains highly sensitive to movements in equity indices.
On the optimistic side, if the U.S. bull market continues and gold prices keep rising (alongside falling bond yields and Fed rate cuts), there is a strong chance that Bitcoin could head toward new all-time highs later this year. However, U.S. equities are already heavily “overbought,” and the market may reassess sentiment while awaiting signals from the Fed and upcoming U.S. data. These could still suggest that labor market challenges may not be “quickly eased by rate cuts,” raising the risk of recession — a scenario that would almost certainly weigh negatively on Bitcoin as well as Wall Street.
Bitcoin ETF inflows accelerate
Last week saw a clear acceleration in net inflows into Bitcoin ETFs, driven by Wall Street optimism, a weaker dollar, and rising expectations of Fed rate cuts. The Federal Reserve is almost certain to cut rates on Wednesday, but historical patterns provide no guarantee that such a decision will translate into short-term gains in equity indices. Theoretically, a bull run on gold should support Bitcoin in medium term, as the BTC price lags gold in approximately 3-months.
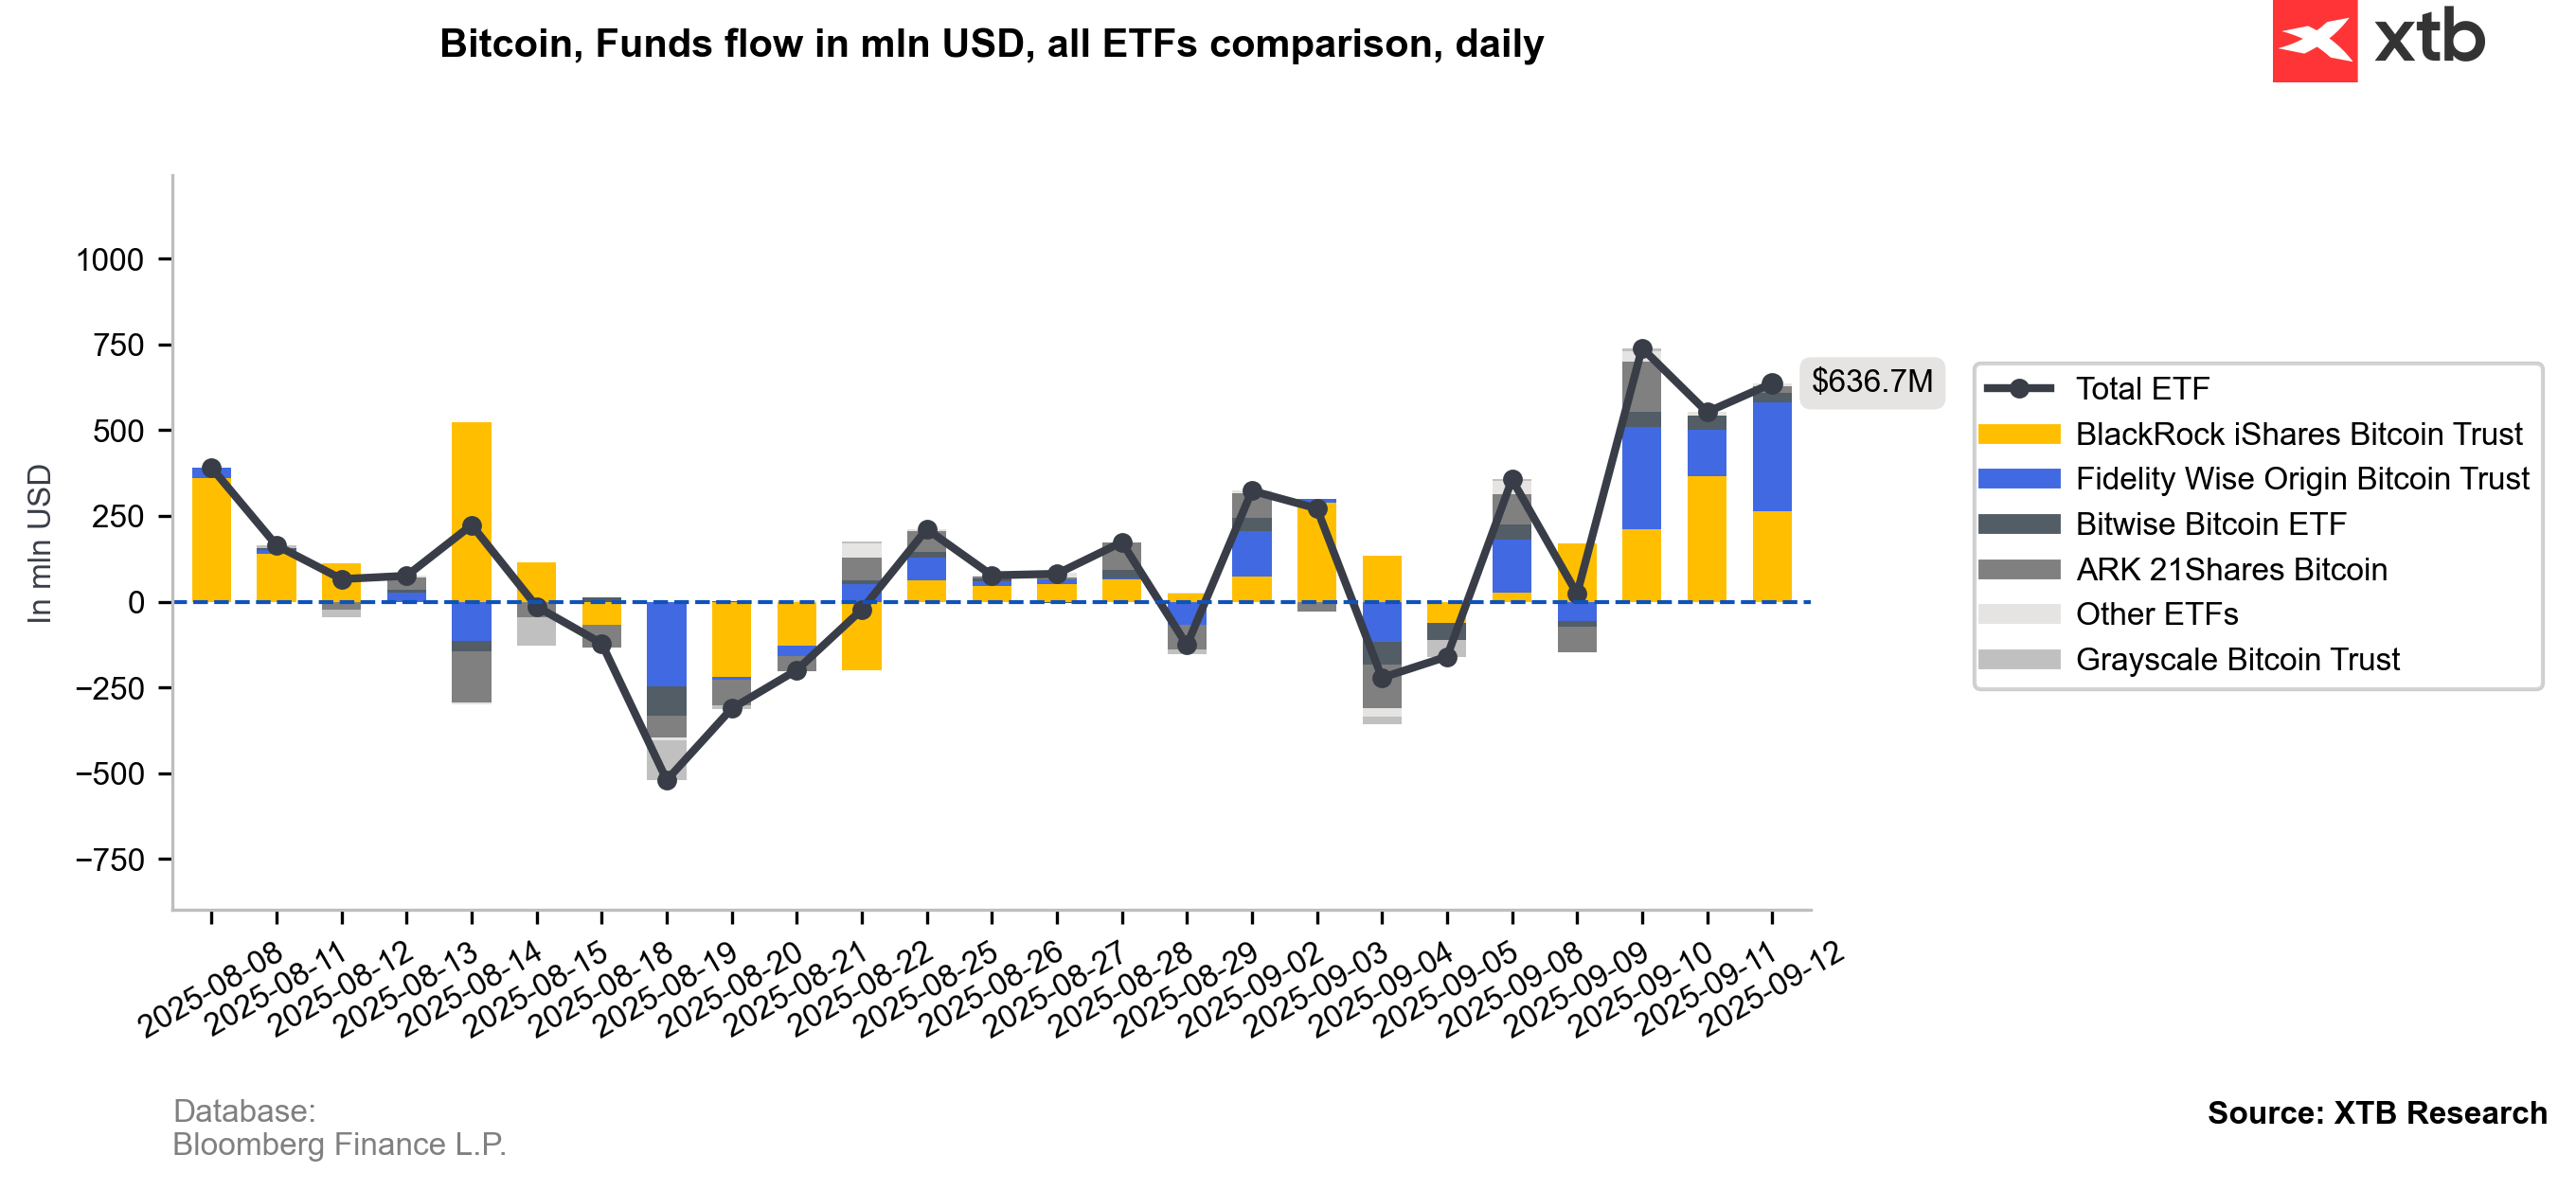
Source: XTB Research, Bloomberg Finance L.P.
On the other hand, on Friday we saw net outflows from ETFs on Ethereum.
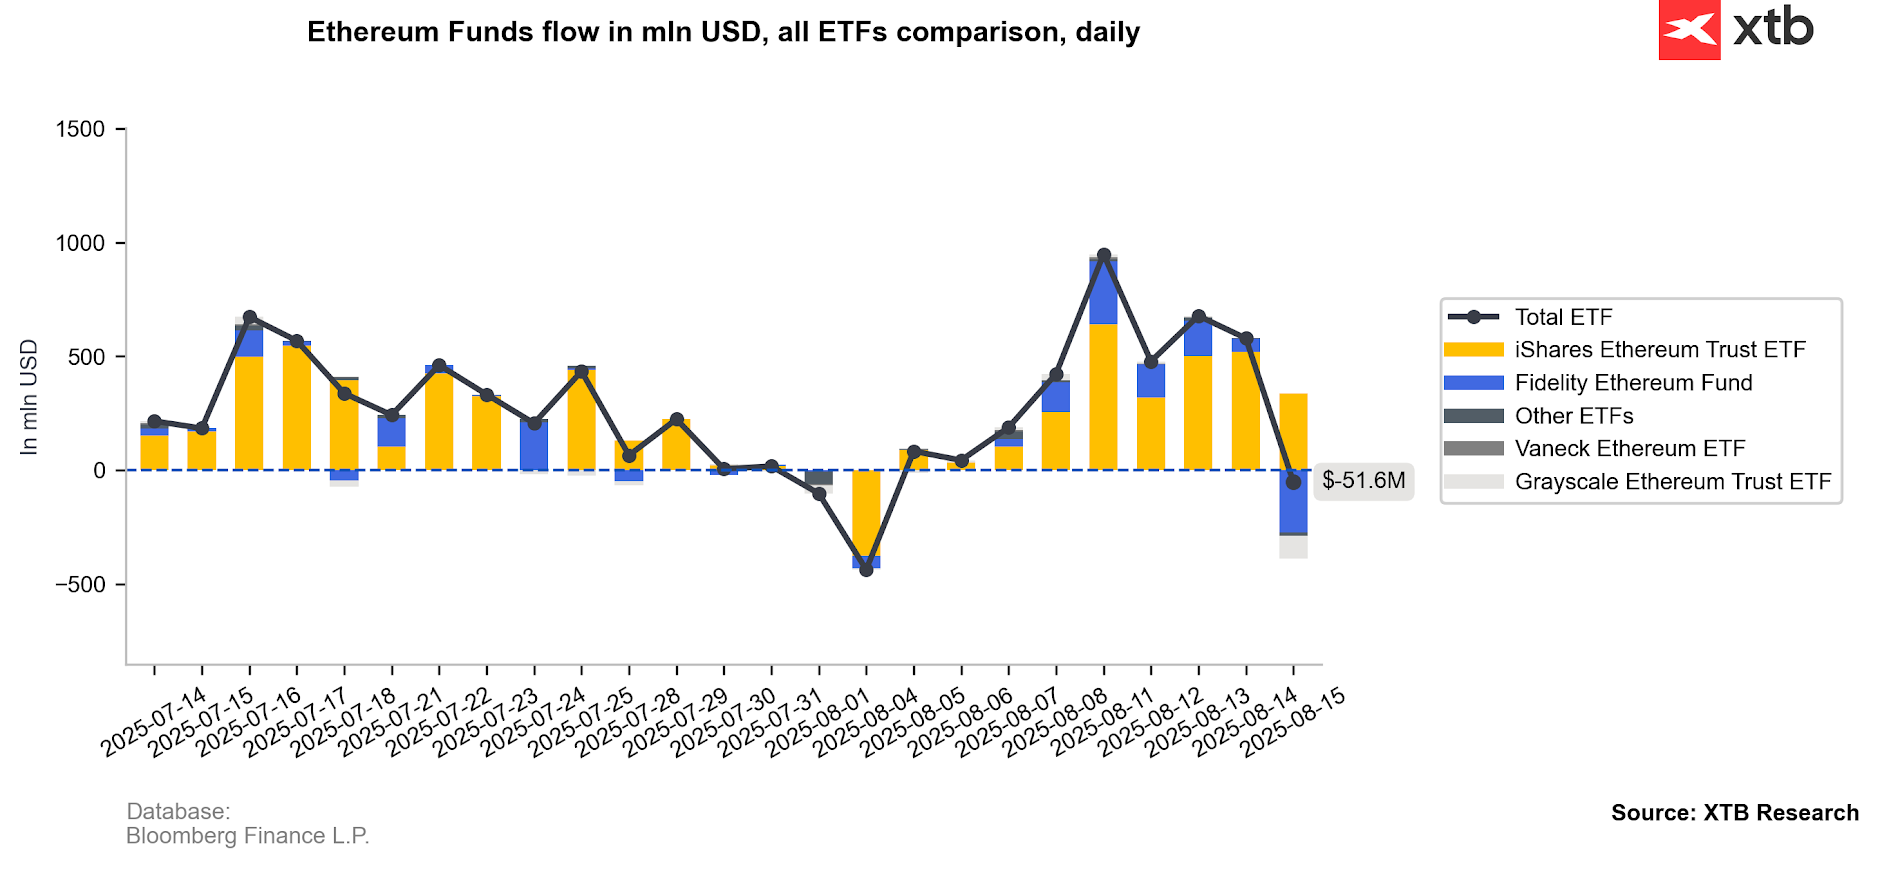
Source: XTB Research, Bloomberg Finance L.P.
Bitcoin & Ethereum Charts (D1 interval)
Bitcoin is fighting to stay above its 50-day exponential moving average (EMA50, orange line) near $114,500. If momentum holds, a move above $120,000 remains possible. On the downside, a break below EMA50 would likely open the way to a test of $108,000 and the 200-day EMA.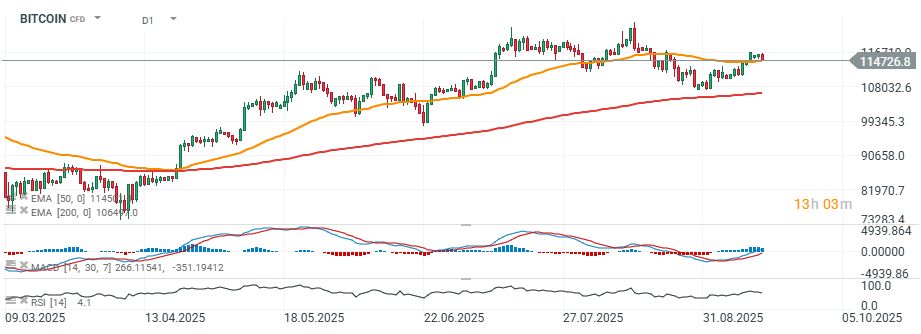
Source: xStation5
The technical outlook for Ethereum is also mixed. If selling pressure accelerates from current levels, a drop toward $4,100 (neckline) would likely confirm a bearish head-and-shoulders (H&S) pattern breakout.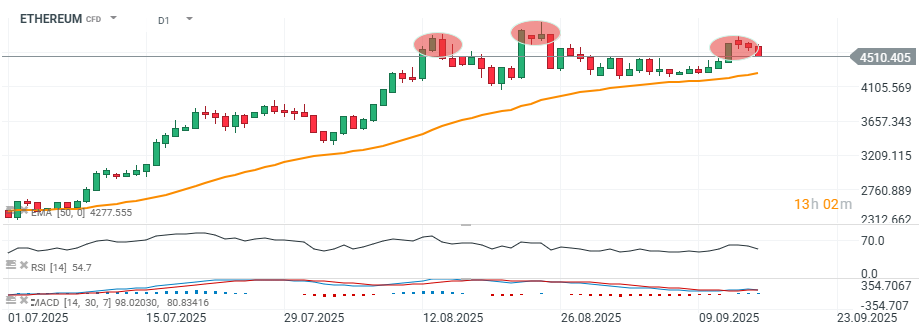
Source: xStation5
BREAKING: BoE keeps rates unchanged 🇬🇧 📌 GBPUSD extends losses 📉

Swiss franc weakens after SNB keeps rates unchanged
Chart of the Day: GBPUSD ahead of BoE decision (18.06.2026)
Economic Calendar - Hawkish Fed Pause and Pivotal SNB and BoE Decisions (18.06.2026)
The material on this page does not constitute as financial advice and does not take into account your level of understanding, investment objectives, financial situation or any other particular needs.
All the information provided, including opinions, market research, mathematical results and technical analyses published on the website or transmitted to you by other means is provided for information purposes only and should in no event be interpreted as an offer of, or solicitation for, a transaction in any financial instrument, nor should the information provided be construed as advice of legal or fiscal nature.
Any investment decisions you make shall be based exclusively on your level of understanding, investment objectives, financial situation or any other particular needs. Any decision to act on information published on the website or transmitted to you by other means is entirely at your own risk. You are solely responsible for such decisions.
If you are in doubt or are not sure that you understand a particular product, instrument, service, or transaction, you should seek professional or legal advice before trading.
Investing in OTC Derivatives carries a high degree of risk, as they are leveraged based products and often small movements in the market could lead to much larger movements in the value of your investment and this could work against you or for you. Please ensure that you fully understand the risks involved, taking into account your investments objectives and level of experience, before trading, and if necessary, seek independent advice.