



Today at 2:30 p.m., we’ll see the September CPI report from the U.S., one of the last key releases ahead of the Fed’s October 27–28 meeting. The consensus forecast calls for a marked acceleration in the core inflation measure to 0.6% MoM (from 0.4% in August) and to around 3.6–3.7% y/y, largely driven by fuel prices, which, according to the EIA, rose by more than 7% in September. However, the core measure (excluding food and energy)—which is more important to the Fed—is expected to slow to 0.2% MoM from 0.3% previously, with the annual rate around 2.5%. It is precisely this divergence—the hot headline figure versus the cooling core measure—that will be the focus of today’s market reaction.
For the Fed, the underlying trend is what matters most. If it does indeed hold steady at 0.2%, this will ease the pressure on the October meeting. The market currently prices in only about a 22% chance of a rate hike this month and will shift its focus to December, which remains the baseline scenario for the next 25-basis-point move. As a reminder, in September the Fed raised rates for the first time in three years, to the 3.75–4.00% range, signaling further tightening. A reading above expectations—especially if the energy shock began to feed through to a broader basket of prices—would quickly reignite hawkish bets and support the dollar.
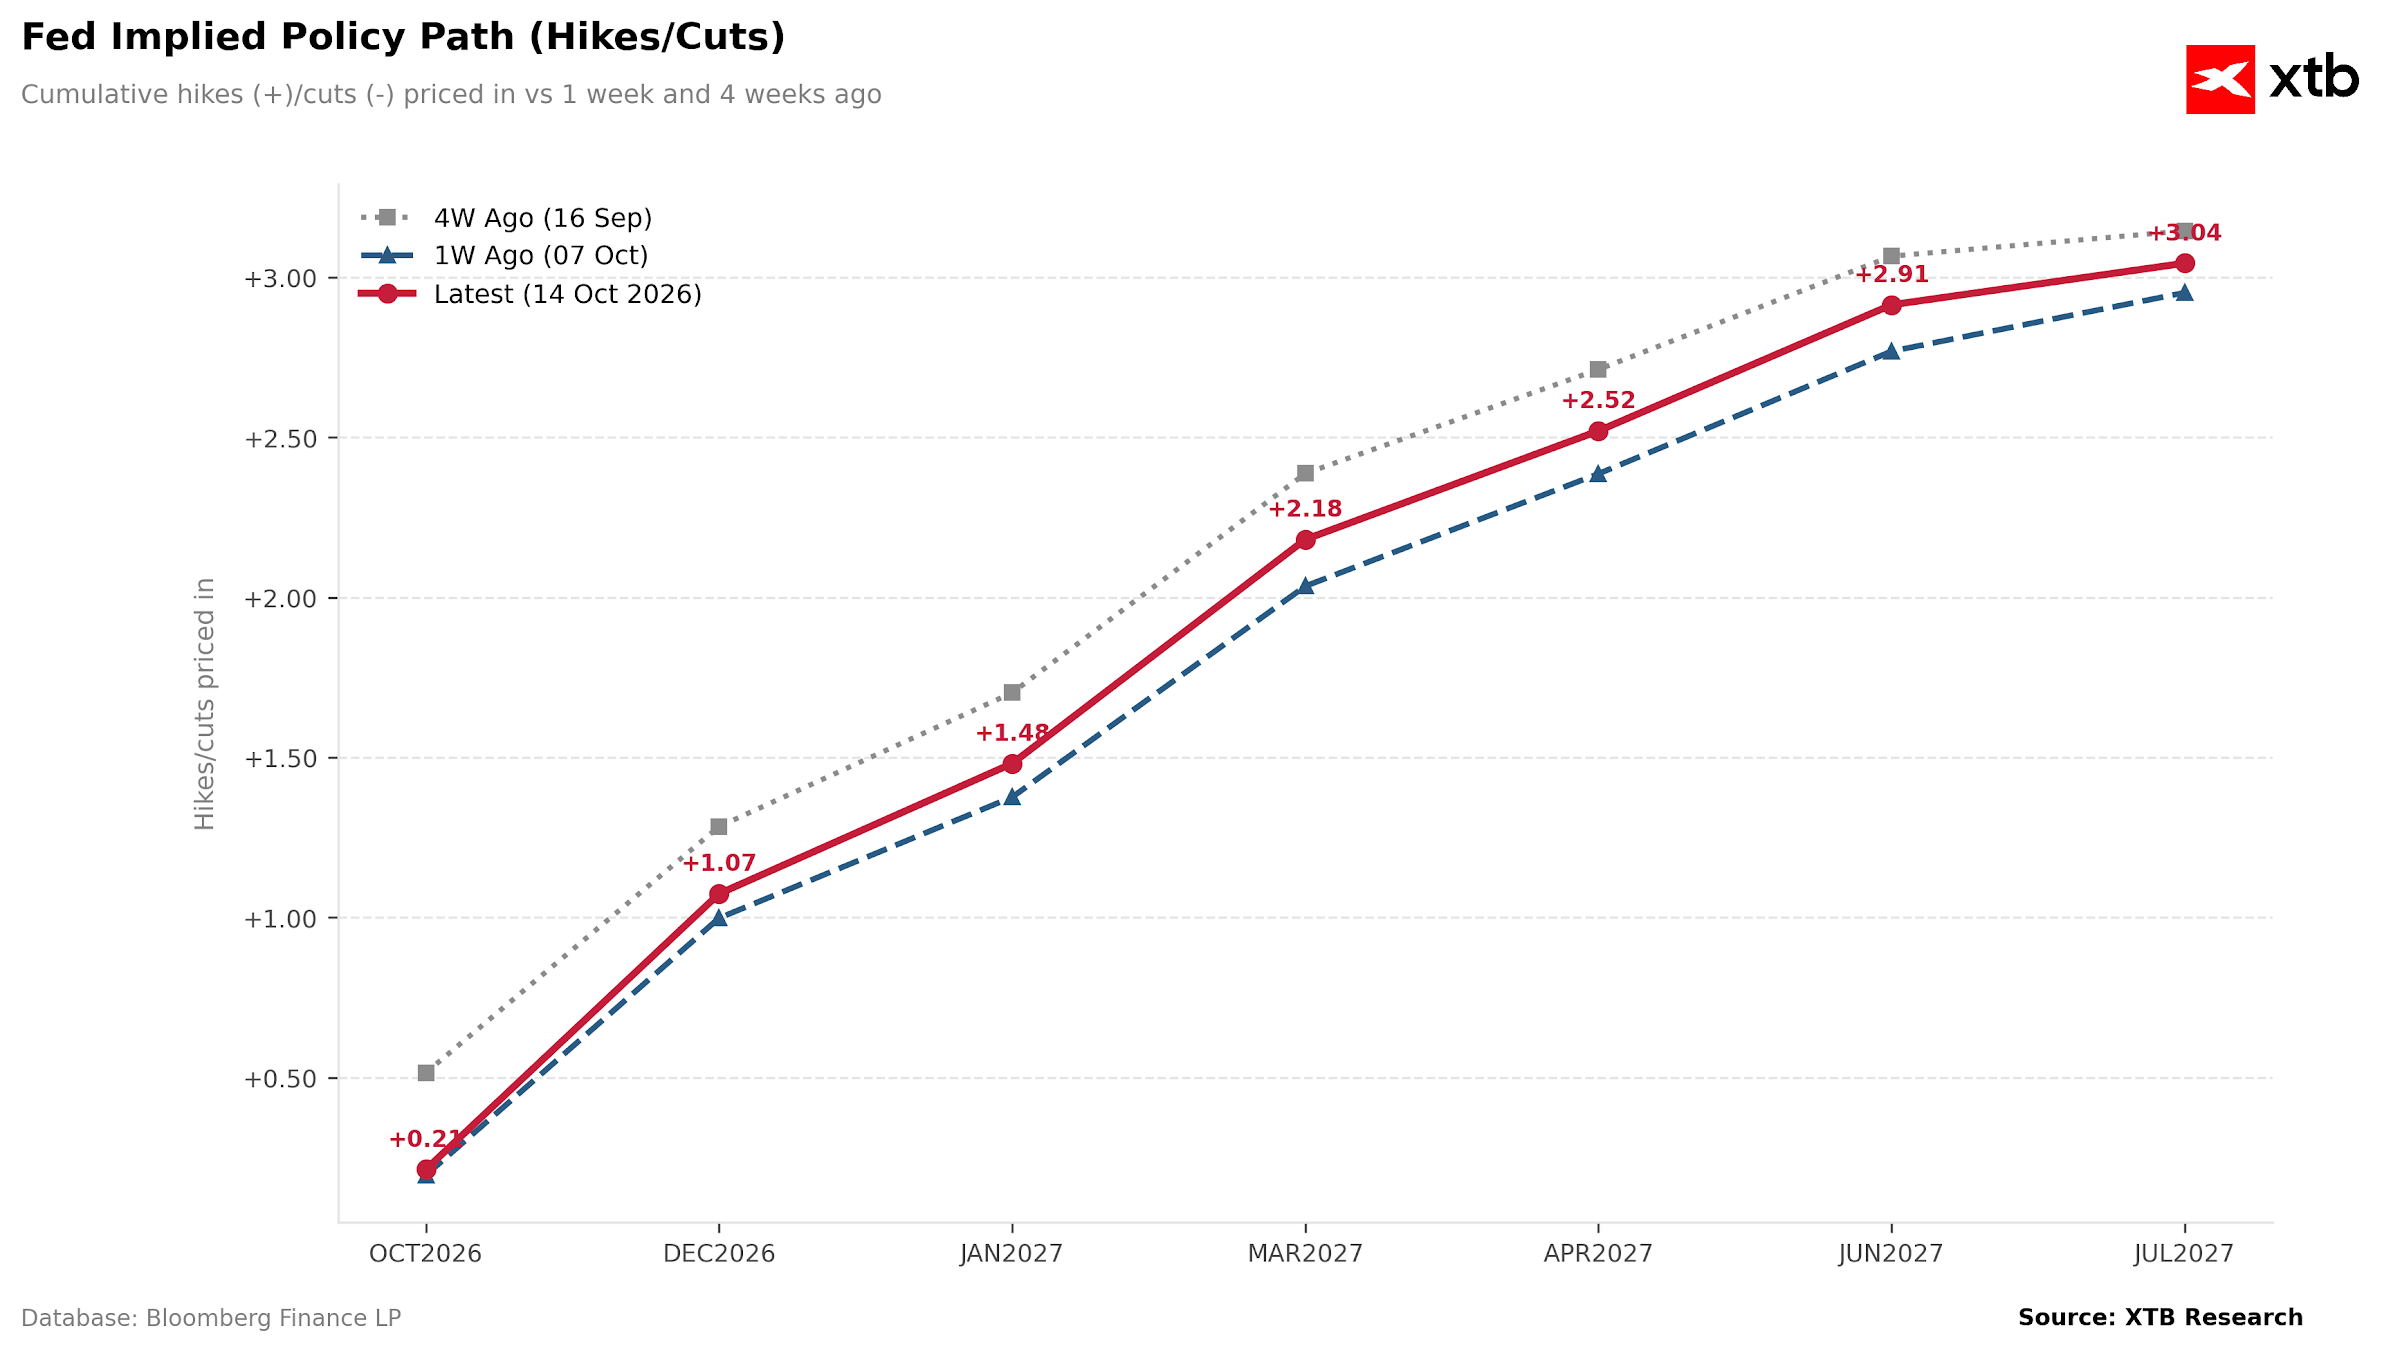
Chart 1 — The Fed’s policy path as priced in by the market. The chart shows the cumulative number of rate hikes priced in for upcoming meetings — today (red line), a week ago (blue), and four weeks ago (gray). The market has consistently priced in tightening: from about +0.2 rate hikes for October, through +1.07 for December, up to over +3.0 by July 2027. Importantly, the most recent path (red) lies above last week’s path but below last month’s reading—the market has slightly tempered its hawkish expectations following weaker payrolls and cooler PCE data, but the overall trend remains firmly “upward.” Source: XTB
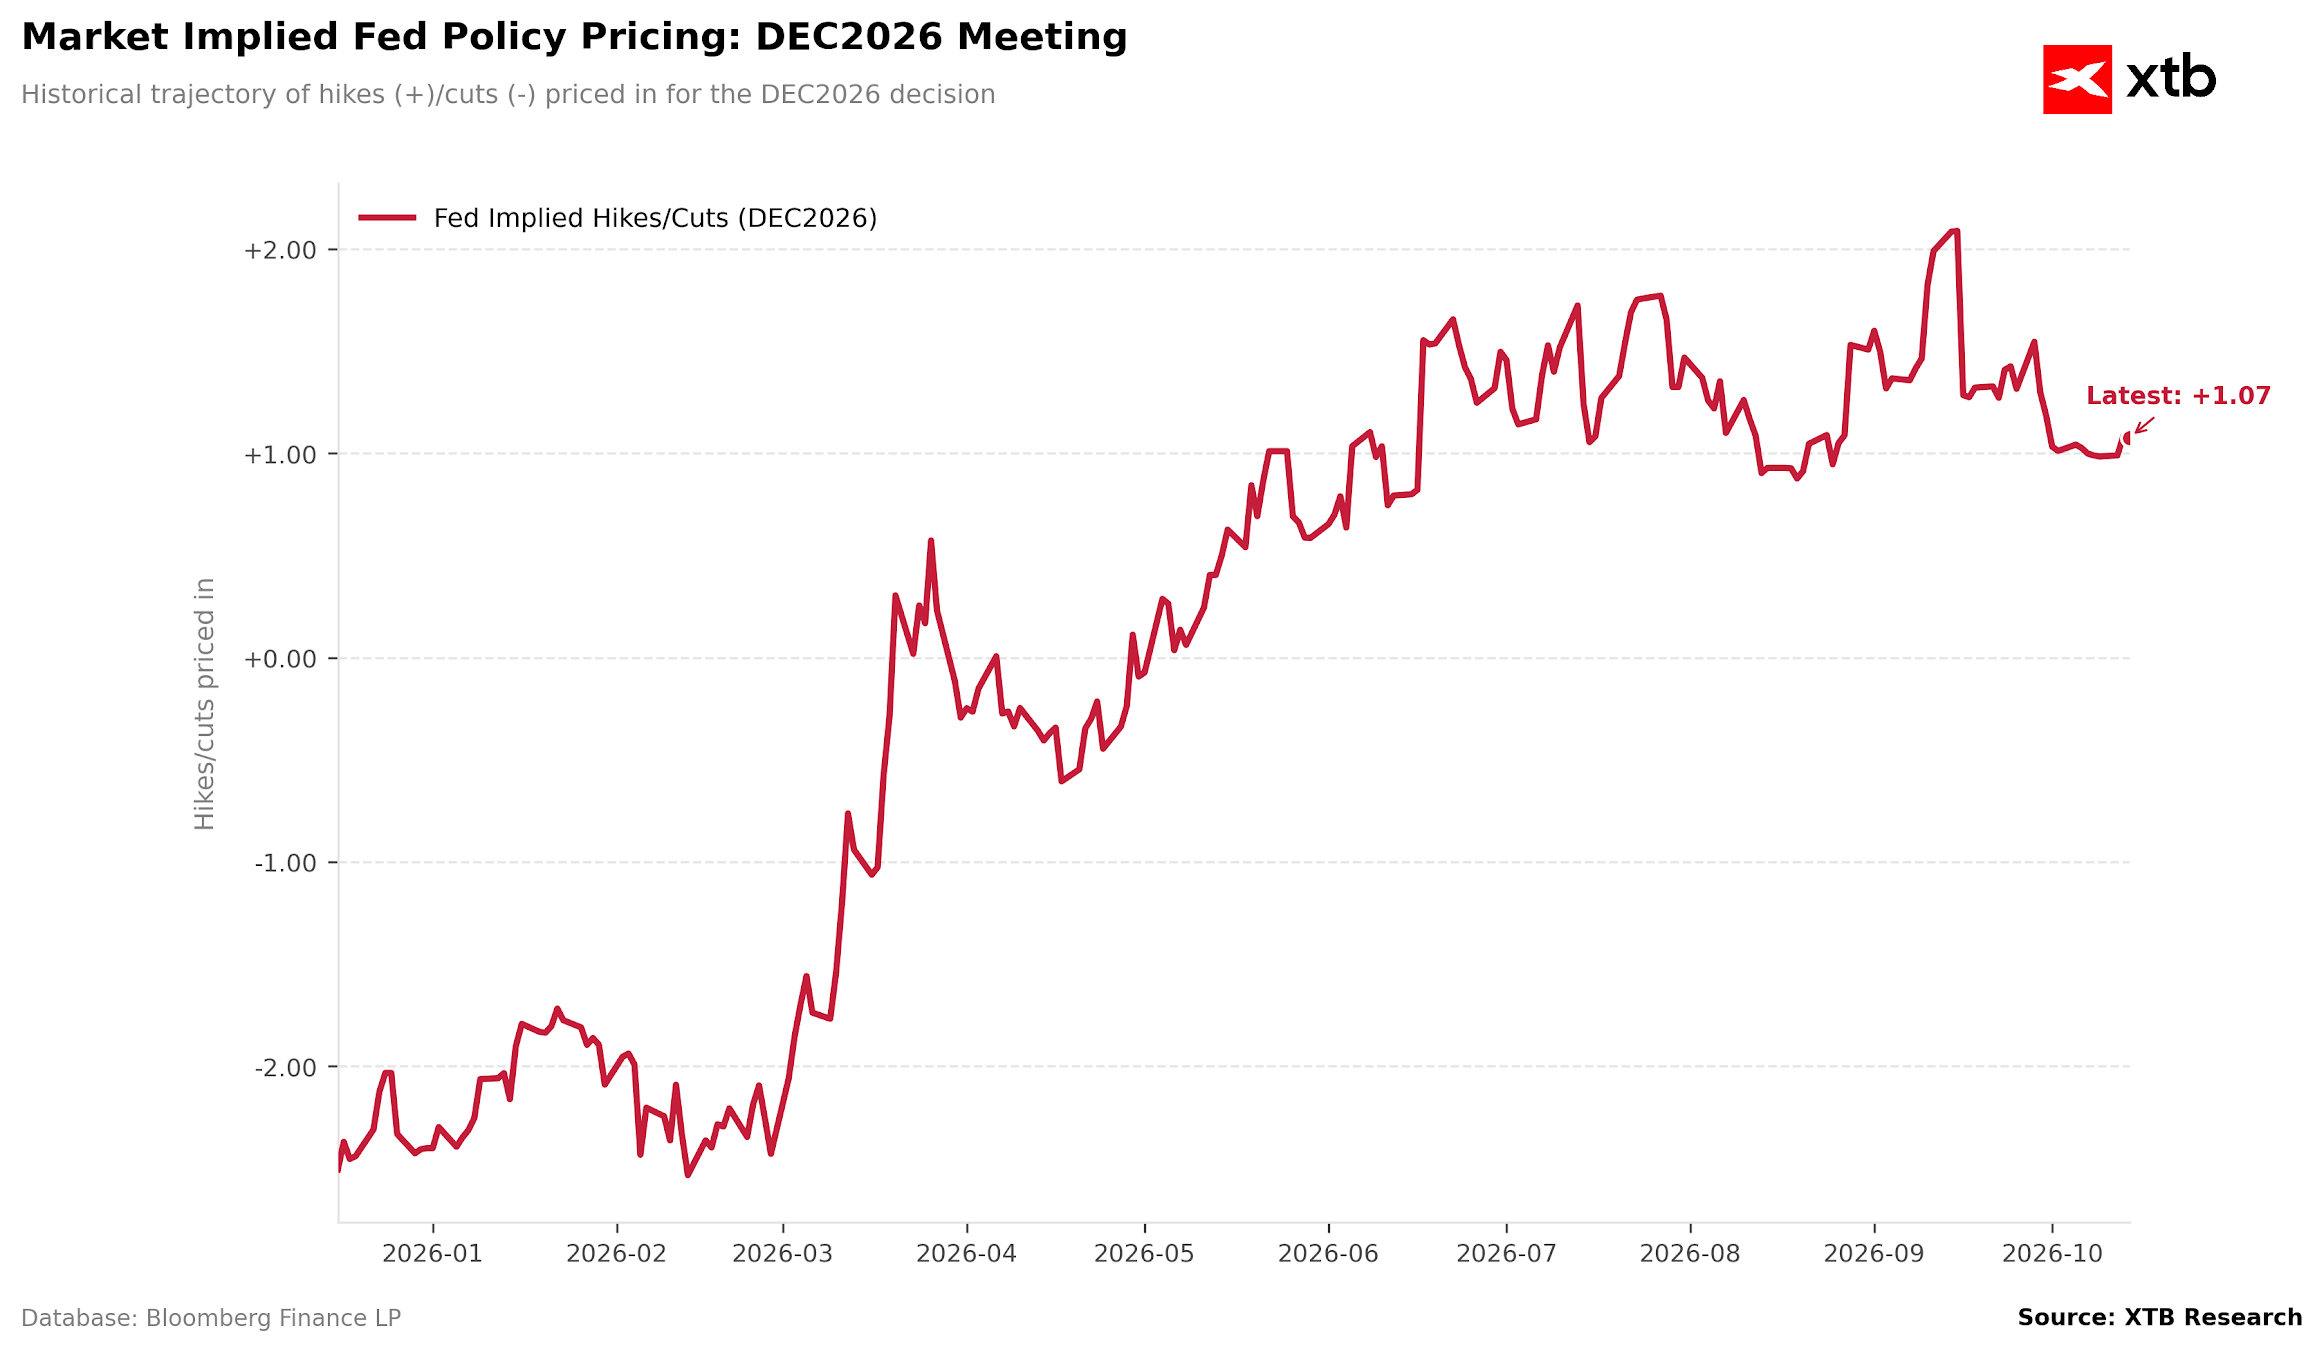
Chart 2 — Pricing History for the December Meeting. The second chart illustrates how the pricing of the December 2026 decision has changed over the course of the year. As recently as early 2026, the market was pricing in rate cuts (around -2.5), but starting in March, the narrative shifted sharply toward rate hikes, and a spike in inflation following disruptions in oil supplies pushed the market’s pricing into the +1.0 / +2.0. The current reading of +1.07 marks a pullback from September’s highs—the market is hawkish, but not to the extreme, leaving room for movement in either direction following today’s data. Source: XTB
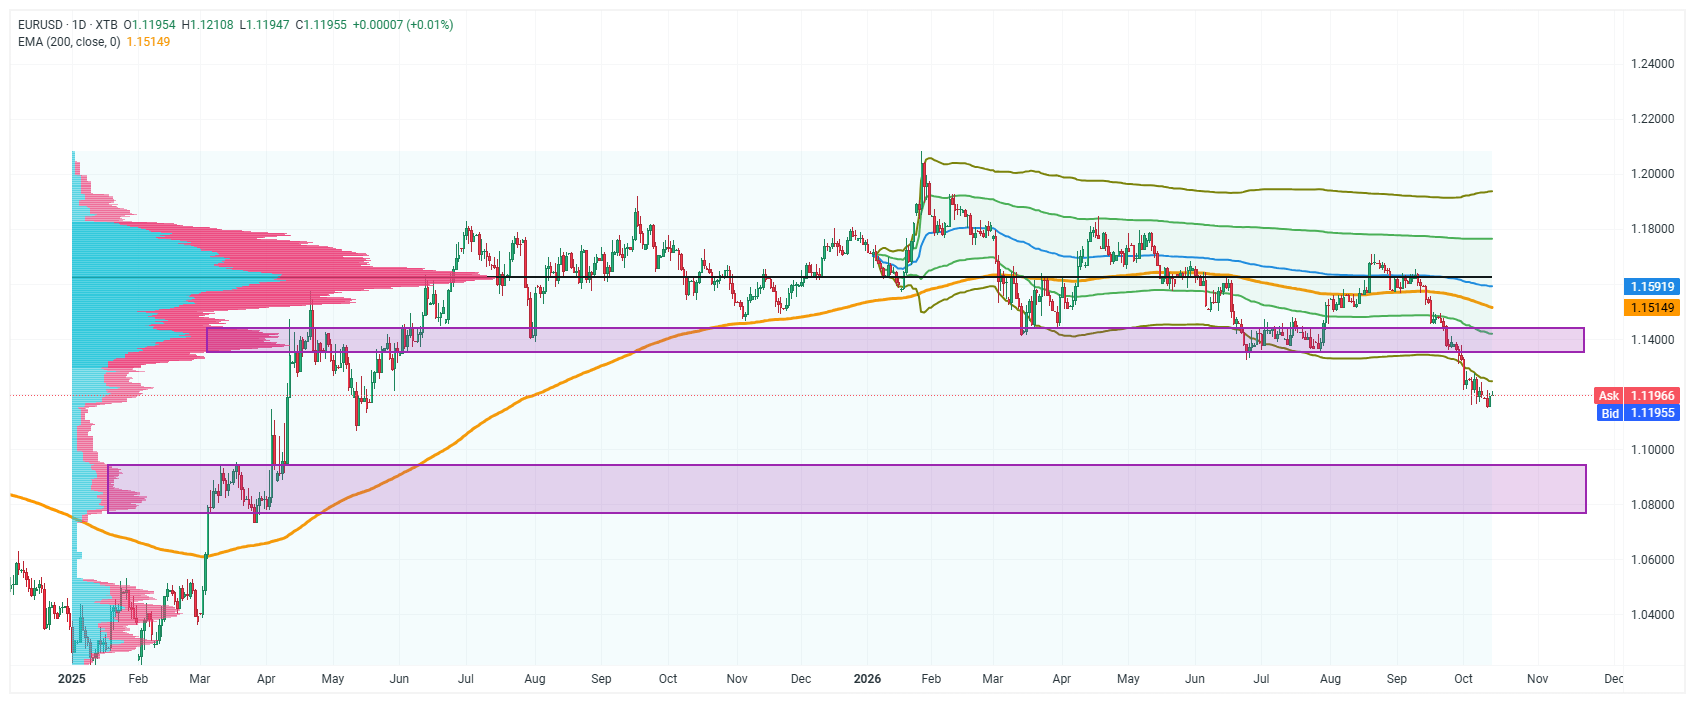
Technical Analysis of EUR/USD. On the daily chart, the pair is trading around 1.1195, well below the 200-session exponential moving average (EMA200) at 1.1515, which underscores the strength of the supply side in the medium term. The price has just fallen below the lower boundary of the broad consolidation zone marked by the purple rectangle (approx. 1.1400–1.1440), which previously served as support and may now begin to act as resistance. The volume profile shows that the largest concentration of trading volume is higher up, in the 1.15–1.16 range, which further hinders a bullish rebound. The nearest significant support is around 1.1150–1.1200, and in the event of a further sell-off, the path opens up to the next demand zone visible much lower, at 1.0800–1.0950. A hot CPI reading, which would strengthen the dollar and fuel hawkish expectations regarding the Fed, could deepen the decline and push the exchange rate toward lower support levels; conversely, a milder core reading would give the euro a chance for a corrective rebound toward 1.1400 and a retest of the recently lost zone from below. Source: XTB



US CPI above expectations!🔥📈



Market Wrap: ASML lifts tech sentiment, EU yields pull back


Economic Calendar: US CPI Inflation Data in Focus (14.10.2026)
Chart of the Day 📈 EURUSD attempts to rebound ahead of US inflation data (14.10.2026)
The material on this page does not constitute as financial advice and does not take into account your level of understanding, investment objectives, financial situation or any other particular needs.
All the information provided, including opinions, market research, mathematical results and technical analyses published on the website or transmitted to you by other means is provided for information purposes only and should in no event be interpreted as an offer of, or solicitation for, a transaction in any financial instrument, nor should the information provided be construed as advice of legal or fiscal nature.
Any investment decisions you make shall be based exclusively on your level of understanding, investment objectives, financial situation or any other particular needs. Any decision to act on information published on the website or transmitted to you by other means is entirely at your own risk. You are solely responsible for such decisions.
If you are in doubt or are not sure that you understand a particular product, instrument, service, or transaction, you should seek professional or legal advice before trading.
Investing in OTC Derivatives carries a high degree of risk, as they are leveraged based products and often small movements in the market could lead to much larger movements in the value of your investment and this could work against you or for you. Please ensure that you fully understand the risks involved, taking into account your investments objectives and level of experience, before trading, and if necessary, seek independent advice.