



The Spanish stock market is seeing its strongest rebound in months. The IBEX 35 is back above 19,300 points following the U.S. election
Spain’s IBEX 35 index rose more than 3 percent on Wednesday and was one of the strongest markets in Europe. Investors returned to assets in a country that, over the past year and a half, has clashed with Donald Trump more often than any other U.S. ally. The SPA35 futures contract rose by 566 points to 19,359 points.
Madrid was one of the U.S. president’s favorite targets for criticism. The first major clash occurred in June 2025 during the NATO summit in The Hague. Pedro Sánchez’s government was the only one to secure an exemption from the new defense spending target of 5 percent of GDP. Trump called Spain’s stance “awful” and announced that the country would “pay double” in trade negotiations. In the fall of 2025, the dispute intensified. The U.S. president suggested that Spain could be expelled from the Alliance and openly spoke of a “trade penalty” in the form of tariffs. Tensions were also fueled by Sánchez’s sharp criticism of Israel’s operation in the Gaza Strip, Spain’s embargo on arms trade with Israel, and a digital tax targeting American tech companies. Political risk thus regularly factored into the valuations of Spanish assets and weighed primarily on exporters and banks. In July of this year, Trump announced that he wanted to freeze all trade with that country.
The market views Tuesday’s midterm elections as a moment when the White House’s room to maneuver in trade policy may narrow. Along with this, the risk of an escalation targeting Madrid is diminishing. It is precisely this factor, combined with the weakening of the geopolitical premium in the oil market, that is driving Wednesday’s rally. Meanwhile, the Spanish economy remains one of the fastest-growing in the eurozone, and for IBEX companies, lower energy prices mean cost relief.
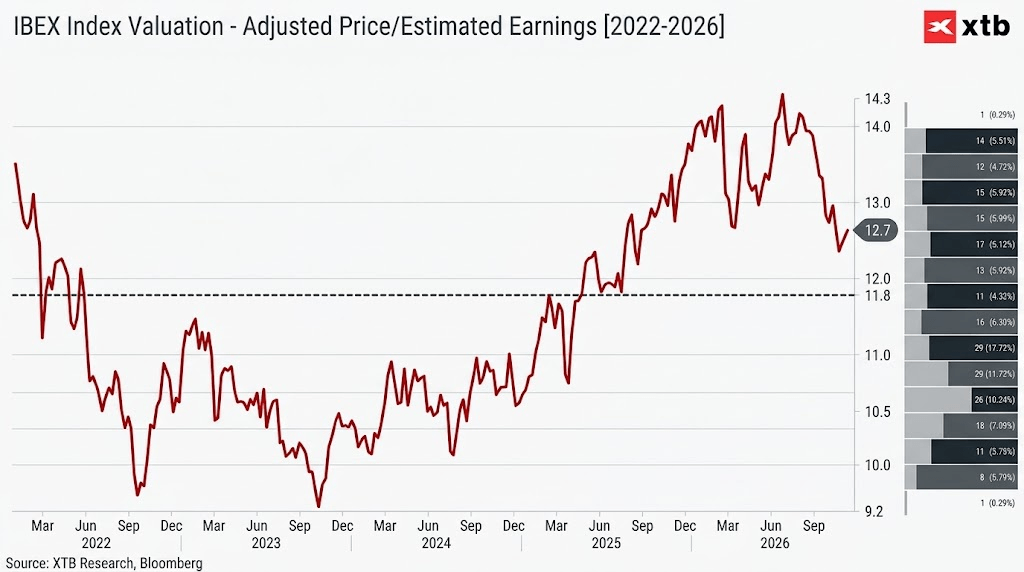
According to Bloomberg data, the price-to-forecast-earnings ratio for the IBEX currently stands at 12.7. It peaked at 14.3 in mid-2026, and valuations have fallen significantly since then. However, the index is still trading above its recent-year average of 11.8, though it is far from overvalued levels. Source: XTB
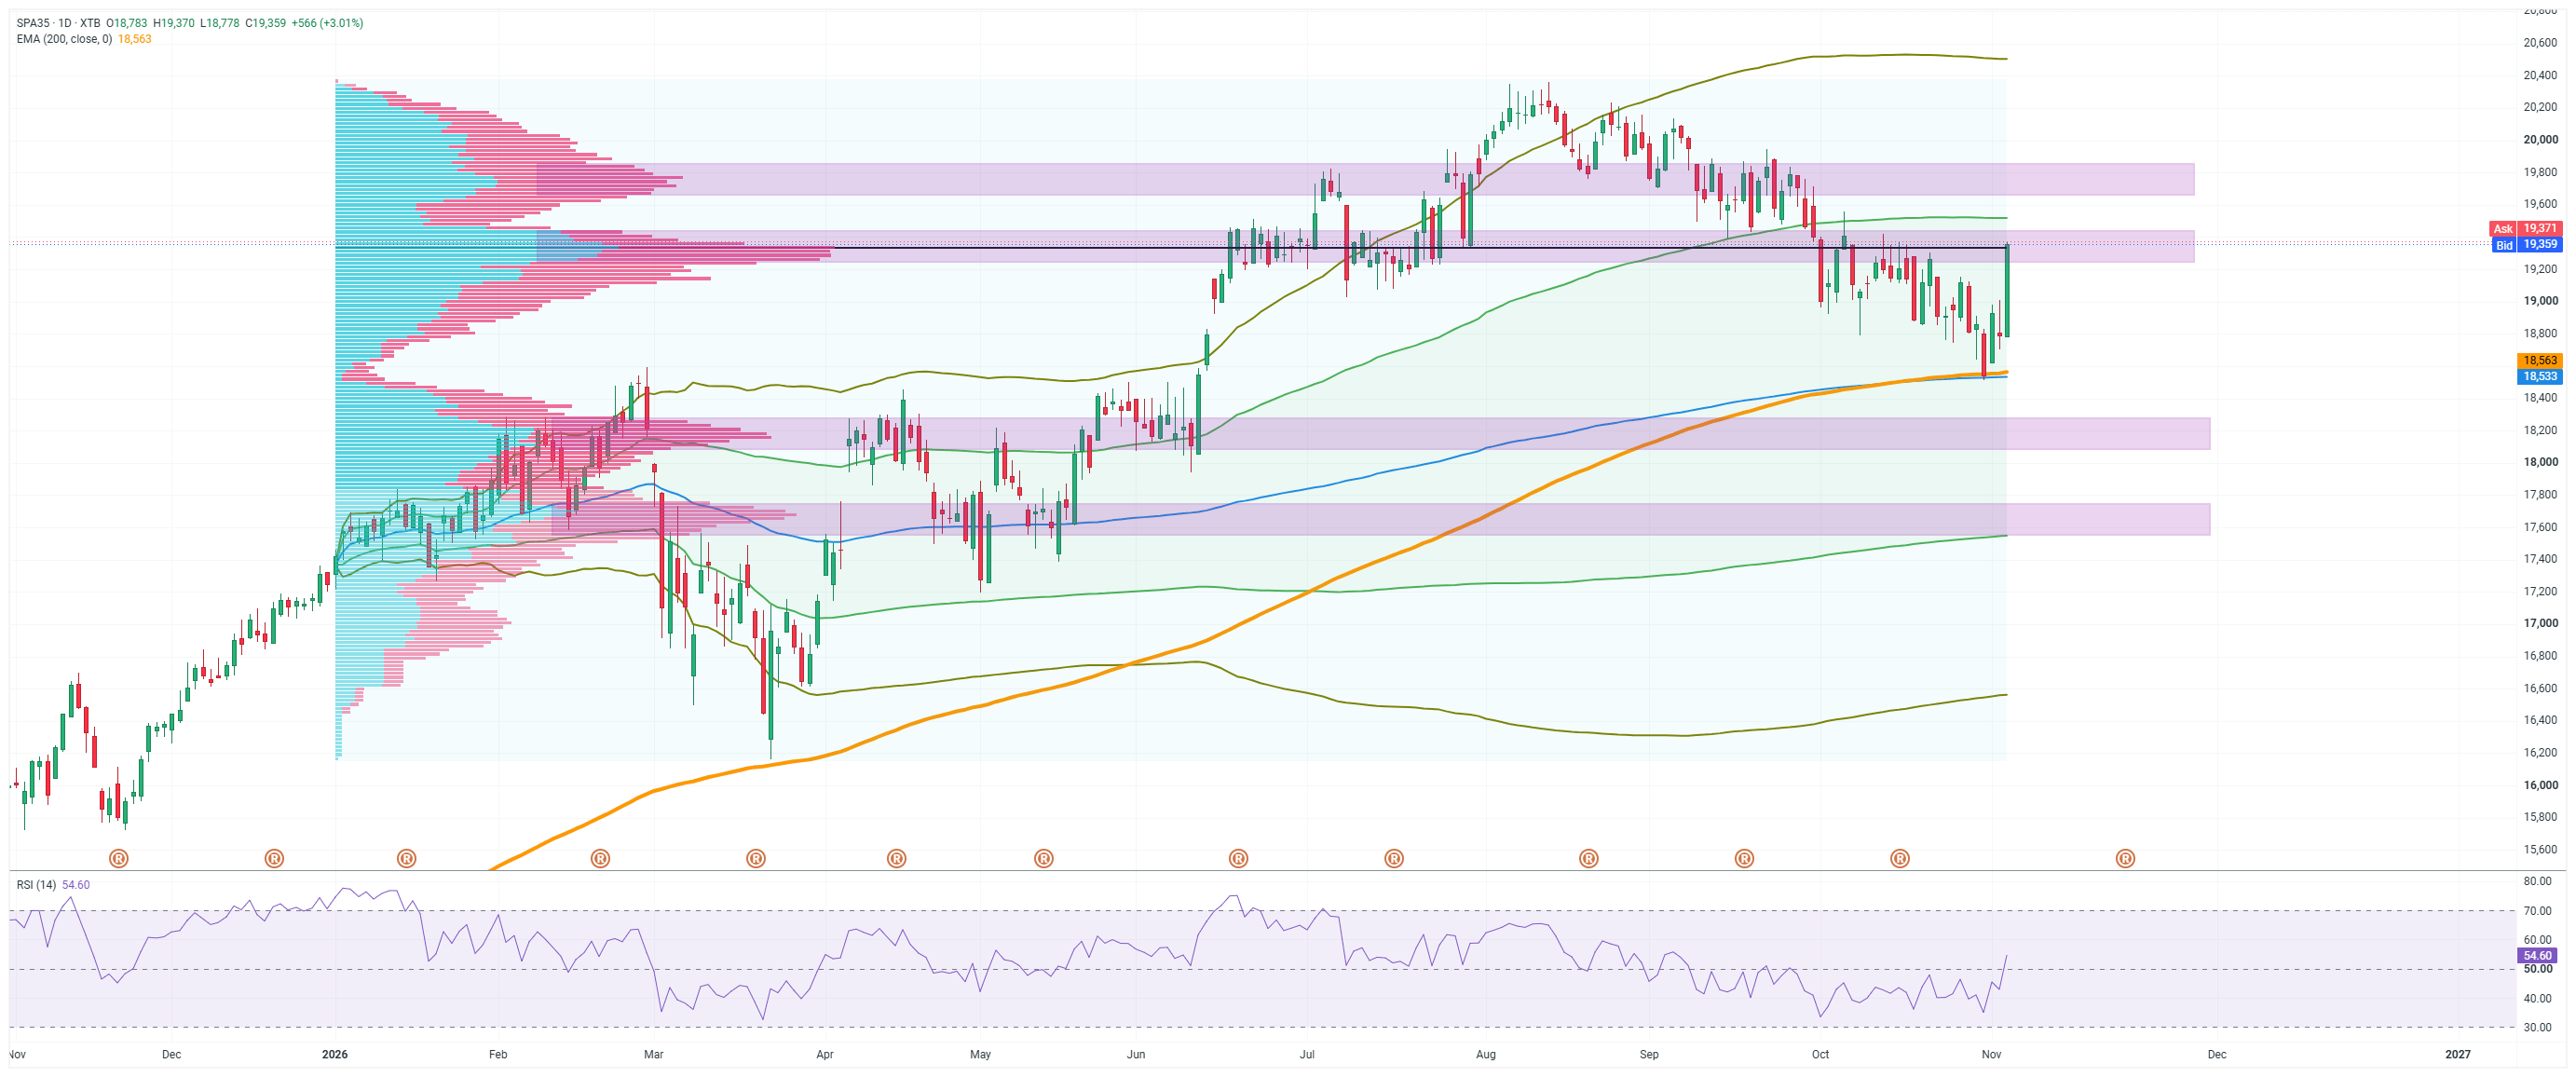
The daily chart shows that the rebound began at a technically very significant level. At the turn of October and November, the index fell to its 200-session exponential moving average at 18,563 points, which almost coincides with the second long-term trend line at 18,533 points. Wednesday’s candlestick formed with virtually no lower shadow and closed near its highs, indicating a possible advantage for buyers.
However, the index immediately encountered its first major hurdle. The range from 19,250 to 19,420 points is a purple zone defined by the volume profile, within which lies a control point—that is, the level with the highest trading volume since the beginning of the year. This is where the market previously consolidated for the longest period, and where rebound attempts stalled in September and October. A sustained break above this zone would open the way to the next resistance level at 19,680 to 19,850 points, and further toward the August records around 20,300 points. A rejection of this level would signal a return to test the moving averages at 18,550 points. Deeper support remains in the volume zones between 18,100 and 18,250 points and between 17,550 and 17,750 points.
The RSI has broken above the 50 level and stands at 54.6. This is the first such signal in weeks, confirming that momentum is shifting in favor of the bulls, though the market is still far from overbought. Whether the Spanish stock market will return to its bid for new highs will therefore depend on the upcoming battle for the control point zone and whether the post-election optimism regarding Madrid proves to be sustainable.


BREAKING: US Labor Market Stronger Than Expected. ADP Report Surprises Ahead of Government Data


Market Wrap: European Stocks Rise Following US Elections


Novo Nordisk Earnings: Downtrend is slowing down


BREAKING: Democrats take both chambers of Congress🗽
The material on this page does not constitute as financial advice and does not take into account your level of understanding, investment objectives, financial situation or any other particular needs.
All the information provided, including opinions, market research, mathematical results and technical analyses published on the website or transmitted to you by other means is provided for information purposes only and should in no event be interpreted as an offer of, or solicitation for, a transaction in any financial instrument, nor should the information provided be construed as advice of legal or fiscal nature.
Any investment decisions you make shall be based exclusively on your level of understanding, investment objectives, financial situation or any other particular needs. Any decision to act on information published on the website or transmitted to you by other means is entirely at your own risk. You are solely responsible for such decisions.
If you are in doubt or are not sure that you understand a particular product, instrument, service, or transaction, you should seek professional or legal advice before trading.
Investing in OTC Derivatives carries a high degree of risk, as they are leveraged based products and often small movements in the market could lead to much larger movements in the value of your investment and this could work against you or for you. Please ensure that you fully understand the risks involved, taking into account your investments objectives and level of experience, before trading, and if necessary, seek independent advice.