
FOMC minutes release at 7:00 pm BST is a top event of the day. Markets will look for hints on a pace of looming quantitative tightening and content of the document may have a big impact on markets, including indices. Commodity traders will focus on DOE report at 3:30 pm BST. Let's take a look at DE30, OIL and US100.
DE30
Let’s start today’s analysis with the German DAX (DE30). Looking at the H4 interval, one can see that the head and shoulders pattern surfaced on the chart. Taking this into account, the continuation of a downward move is possible. According to the classic technical analysis, as long as the price sits below the neckline of the aforementioned formation (red line on the chart below), the market bearss are at advantage. Considering the bearish scenario, the nearest support can be found at 14,100 pts where previous price reactions are located. In case of a bigger sell-off, the area at 13,780 pts should be considered the next support.
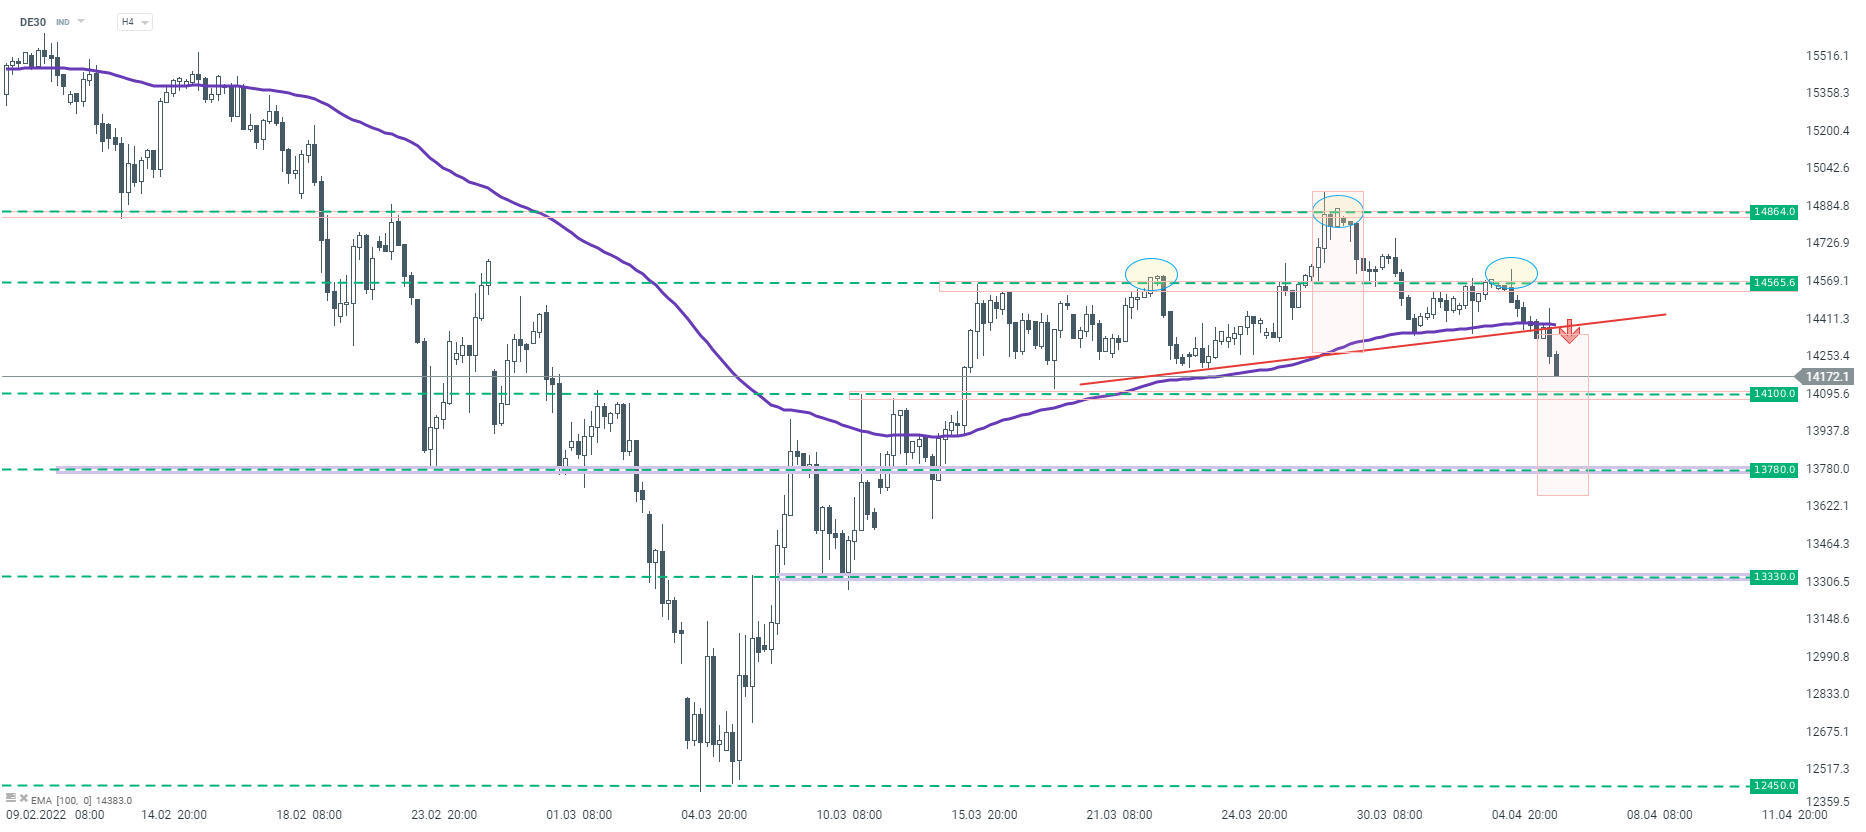 DE30 H4 interval. Source: xStation5
OIL
Next, let’s look at the oil market. Oil price is stuck in a local consolidation move. Looking at the chart on the H1 interval, we can see that buyers managed to keep the price above the $103.40 per barrel. Nevertheless, they did not manage to break through the resistance at $112.00. As long as the price remains between the aforementioned levels, the base scenario is for continuation of a sideways move. Breakout will determine the direction of the next big move.
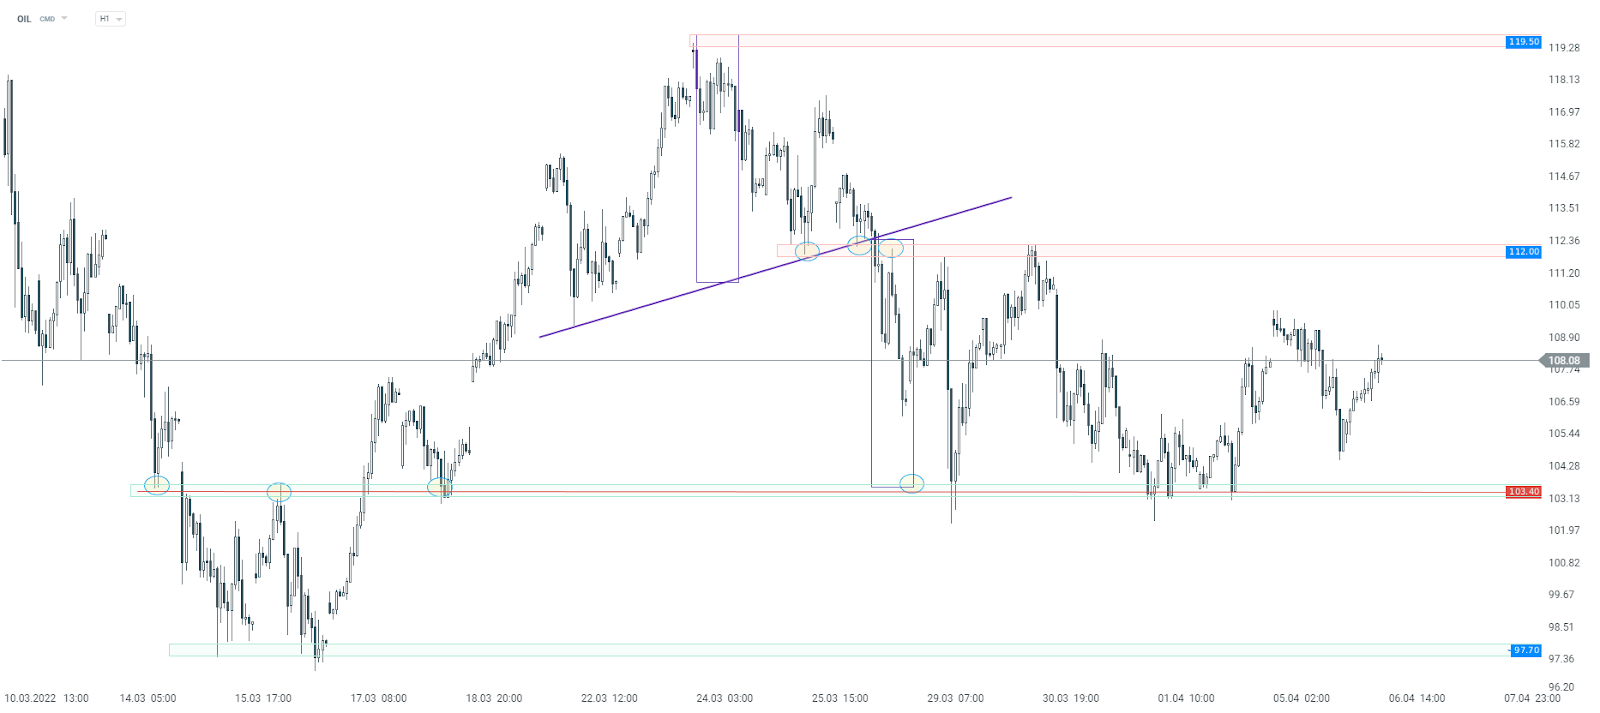
OIL H1 Source: xStation5
US100
Last but not least, let’s take a look at the US100 chart. US index has been trading in an upward move recently. However, the upward momentum weakened at the end of March and downward correction started. Currently we are observing an attempt to break through an important support zone at 14,670 - 14,725. However, if buyers manage to get the zone defended, resumption of an upward movement is possible. On the other hand, if a downward move deepens further, the next support to watch lies at the 14,380 pts, where the 38.2% Fibonacci retracement is located.


Daily Summary: Hot inflation and awaiting for news from Beijing

US OPEN: Higher inflation to cap gains?

Market Wrap: Bulls return to Wall Street (13.05.2026)

OIL: EIA points to a deeper supply shock than expected 🔎
The material on this page does not constitute as financial advice and does not take into account your level of understanding, investment objectives, financial situation or any other particular needs.
All the information provided, including opinions, market research, mathematical results and technical analyses published on the website or transmitted to you by other means is provided for information purposes only and should in no event be interpreted as an offer of, or solicitation for, a transaction in any financial instrument, nor should the information provided be construed as advice of legal or fiscal nature.
Any investment decisions you make shall be based exclusively on your level of understanding, investment objectives, financial situation or any other particular needs. Any decision to act on information published on the website or transmitted to you by other means is entirely at your own risk. You are solely responsible for such decisions.
If you are in doubt or are not sure that you understand a particular product, instrument, service, or transaction, you should seek professional or legal advice before trading.
Investing in OTC Derivatives carries a high degree of risk, as they are leveraged based products and often small movements in the market could lead to much larger movements in the value of your investment and this could work against you or for you. Please ensure that you fully understand the risks involved, taking into account your investments objectives and level of experience, before trading, and if necessary, seek independent advice.