



The energy commodities market is experiencing a sharp sell-off on Monday. Brent crude is down 7.33% to $105.08 per barrel, U.S. WTI is down 5.97% to $96.77, and European natural gas (NATGAS.EU) is plunging by as much as 10.21%—the sharpest move across the entire energy basket. The catalyst is a sudden shift in the geopolitical narrative: U.S. Secretary of State Marco Rubio stated that President Trump prefers to resolve the conflict with Iran diplomatically and “has not made a decision” to attack, while Iranian President Pezeshkian announced that the Supreme Leader has granted the government “certain powers” to engage in peace talks. Iranian and Qatari negotiators have been holding talks for several days on ending the war, and a draft agreement is already circulating.
This hits directly at the risk premium that the market had priced in for the possibility of an escalation following Tuesday’s U.S. midterm elections. Brent closed out October at a six-month high precisely because of fears of a military escalation—now those bets are being rapidly unwound. The oil market continues to react with extreme sensitivity to every headline from the Middle East.
European natural gas, however, is reacting the most strongly—the Dutch TTF contract (NATGAS.EU) is recording its largest one-day drop in many months today, falling by over 10% and giving back a significant portion of the gains driven by concerns over disruptions to LNG supplies from the Gulf and shipments through the Strait of Hormuz. Such a sharp sell-off is a classic example of speculators unwinding positions built on the expectation of escalation. It is worth remembering, however, that there are distinct volume clusters beneath the current prices—zones where the heaviest trading has occurred in recent weeks—and these may serve as natural support levels around which the market will seek equilibrium if the sell-off deepens.
Technical Analysis (NATGAS.EU, daily chart)
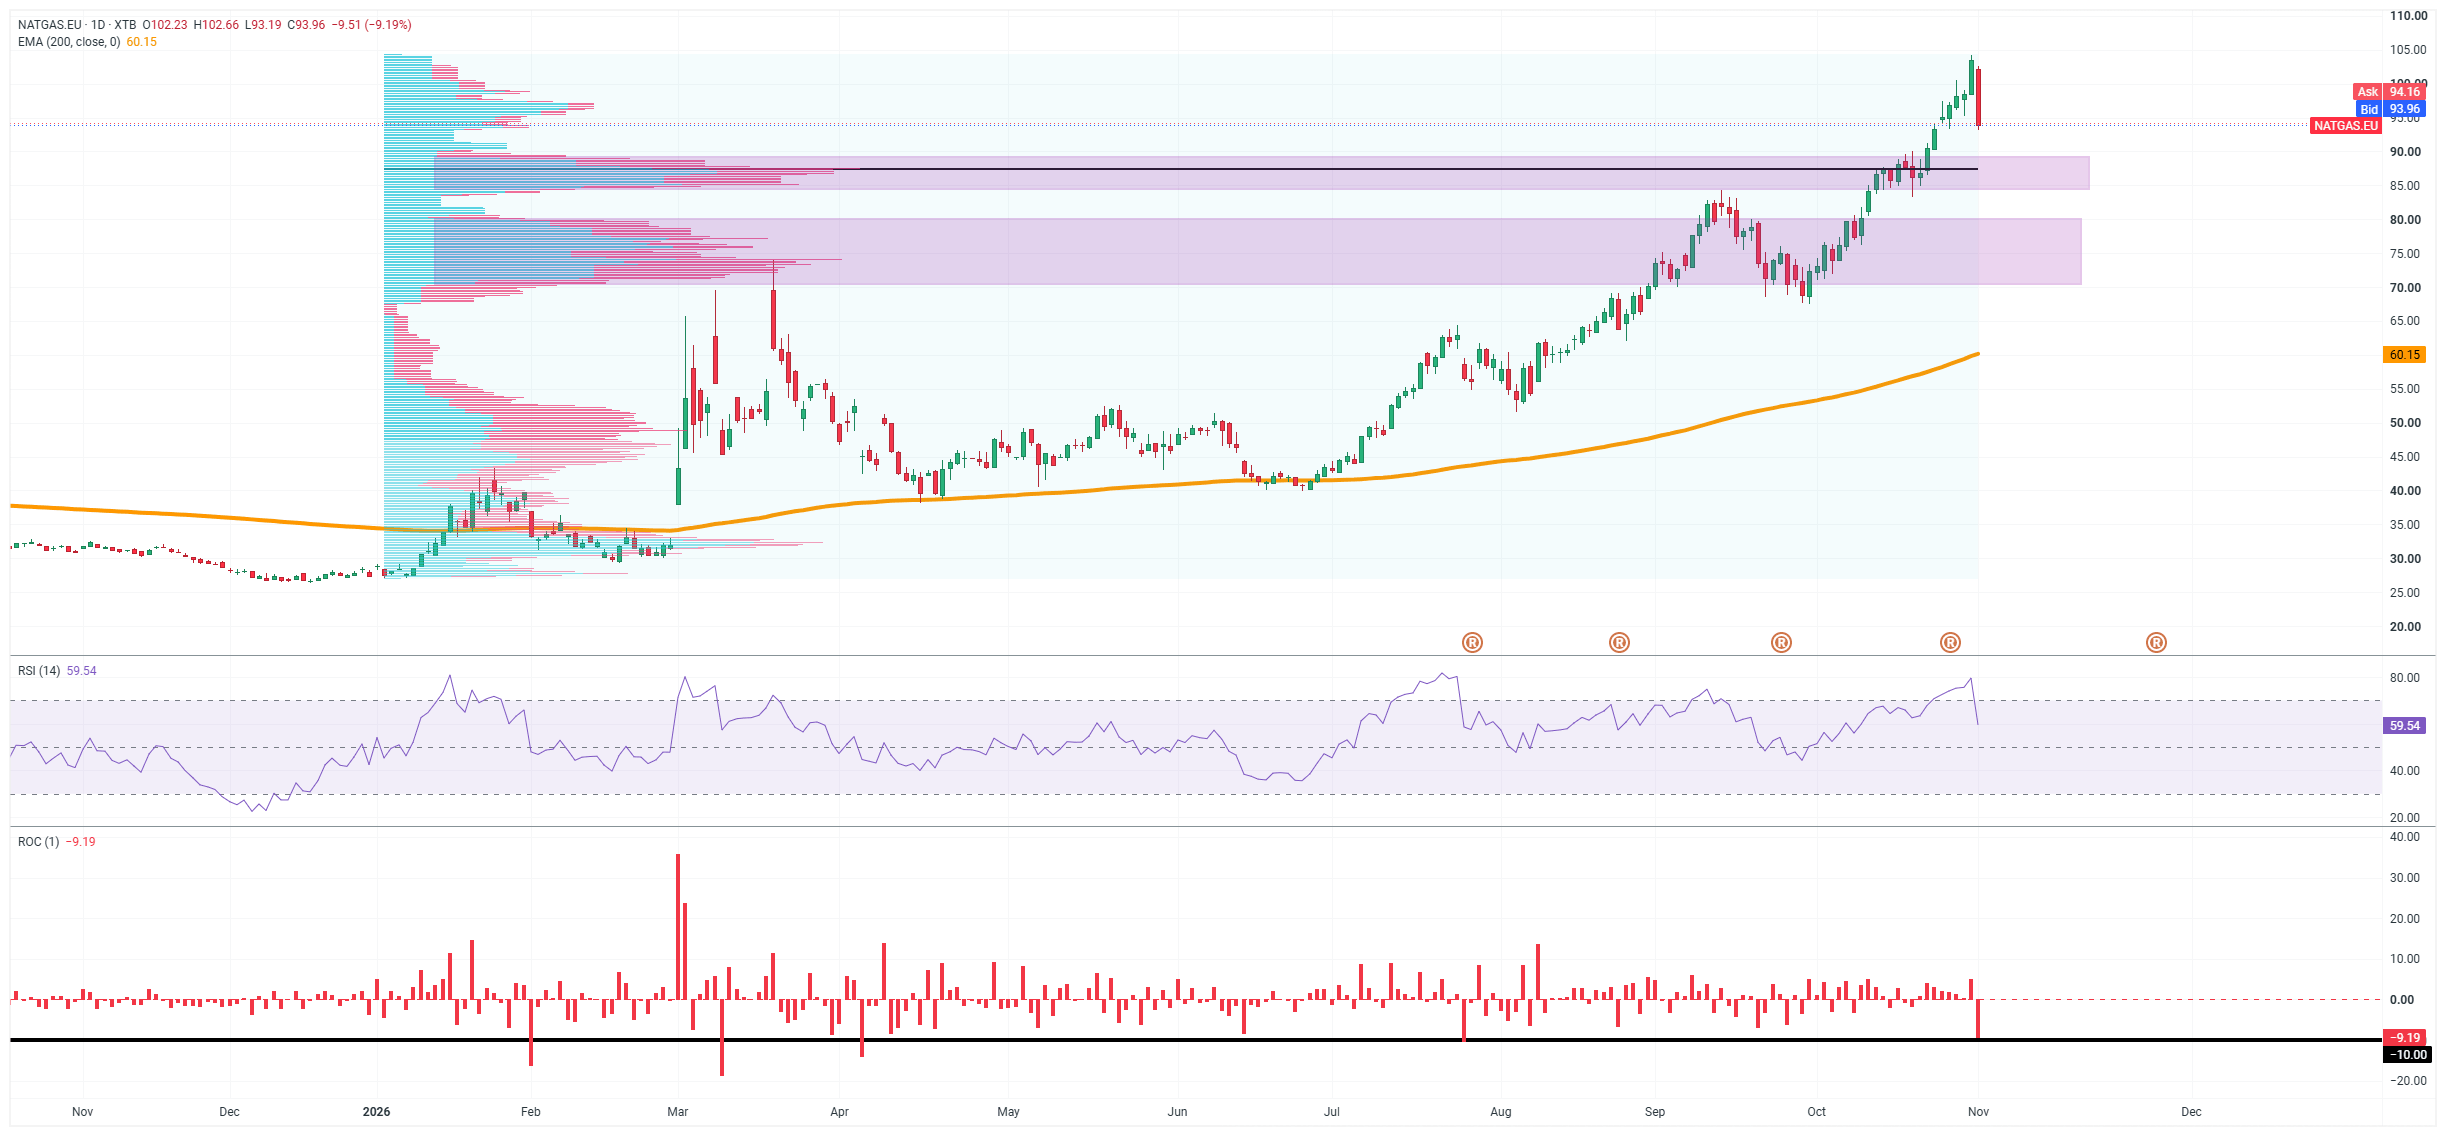
Today’s candlestick is a powerful bearish engulfing pattern that caps off a vertical rally in which the price climbed from around 70 to over 100. The price is down 10.21% and has rejected recent highs, indicating a blow-off top—the culmination of an uptrend driven by the war premium. This is confirmed by the ROC indicator, which plummeted to -10.21, its lowest level in months, signaling an extreme pace of the sell-off.
Two volume clusters visible on the chart are key to the future scenario. The first, upper accumulation zone extends in the 85–90 range, overlapping with the previous structural resistance (black line at ~90)—this is the first significant support level the market may target as part of a correction. The second, denser zone covers the 70–80 range, where the highest trading volume of recent weeks is concentrated; this is the structural foundation of the entire rally and the strongest line of defense for demand. Remaining above these clusters would support the thesis of a healthy correction within an uptrend.
The RSI (14) is falling to 58.65, moving from overbought territory (around 80) toward the neutral midpoint—this is not yet a oversold signal, which leaves room for further cooling before a possible stabilization. As long as the price holds the 85–90 zone, the medium-term advantage remains with the bulls; only a drop below 70 and a breach of the lower volume cluster would open the way toward the EMA200 (around 60) and a reversal of most of this year’s gains.



Daily Summary: From Panic to Euphoria. The Market Recoups Losses.



US OPEN: Falling Oil Prices and Dip-Buying Fuel Rebound as Nvidia falls


Market Wrap: Strong Banking Sector, Sharp Drop in Oil

Economic Calendar: Nvidia at the Center of a Spying Scandal; Oil Prices Fall After Trump's Remarks📆
The material on this page does not constitute as financial advice and does not take into account your level of understanding, investment objectives, financial situation or any other particular needs.
All the information provided, including opinions, market research, mathematical results and technical analyses published on the website or transmitted to you by other means is provided for information purposes only and should in no event be interpreted as an offer of, or solicitation for, a transaction in any financial instrument, nor should the information provided be construed as advice of legal or fiscal nature.
Any investment decisions you make shall be based exclusively on your level of understanding, investment objectives, financial situation or any other particular needs. Any decision to act on information published on the website or transmitted to you by other means is entirely at your own risk. You are solely responsible for such decisions.
If you are in doubt or are not sure that you understand a particular product, instrument, service, or transaction, you should seek professional or legal advice before trading.
Investing in OTC Derivatives carries a high degree of risk, as they are leveraged based products and often small movements in the market could lead to much larger movements in the value of your investment and this could work against you or for you. Please ensure that you fully understand the risks involved, taking into account your investments objectives and level of experience, before trading, and if necessary, seek independent advice.