



U.S. crude oil inventories fell by 8.557 million barrels, while the market had expected an increase of 0.150 million barrels; inventories had declined by 3.186 million barrels previously. The draw in crude and distillate inventories was not offset by the increase in gasoline stocks, which came in far above expectations.
- Gasoline inventories rose by 3.518 million barrels, well above the expected decline of 0.911 million barrels; inventories had increased by 0.382 million barrels previously.
- Distillate inventories fell by 2.527 million barrels, more than the expected decline of 1.720 million barrels; inventories had decreased by 0.042 million barrels previously.
- Crude inventories at the Cushing hub increased by 1.862 million barrels, compared with a rise of 0.444 million barrels in the previous week.
U.S. oil market tightens as inventories fall below seasonal norms
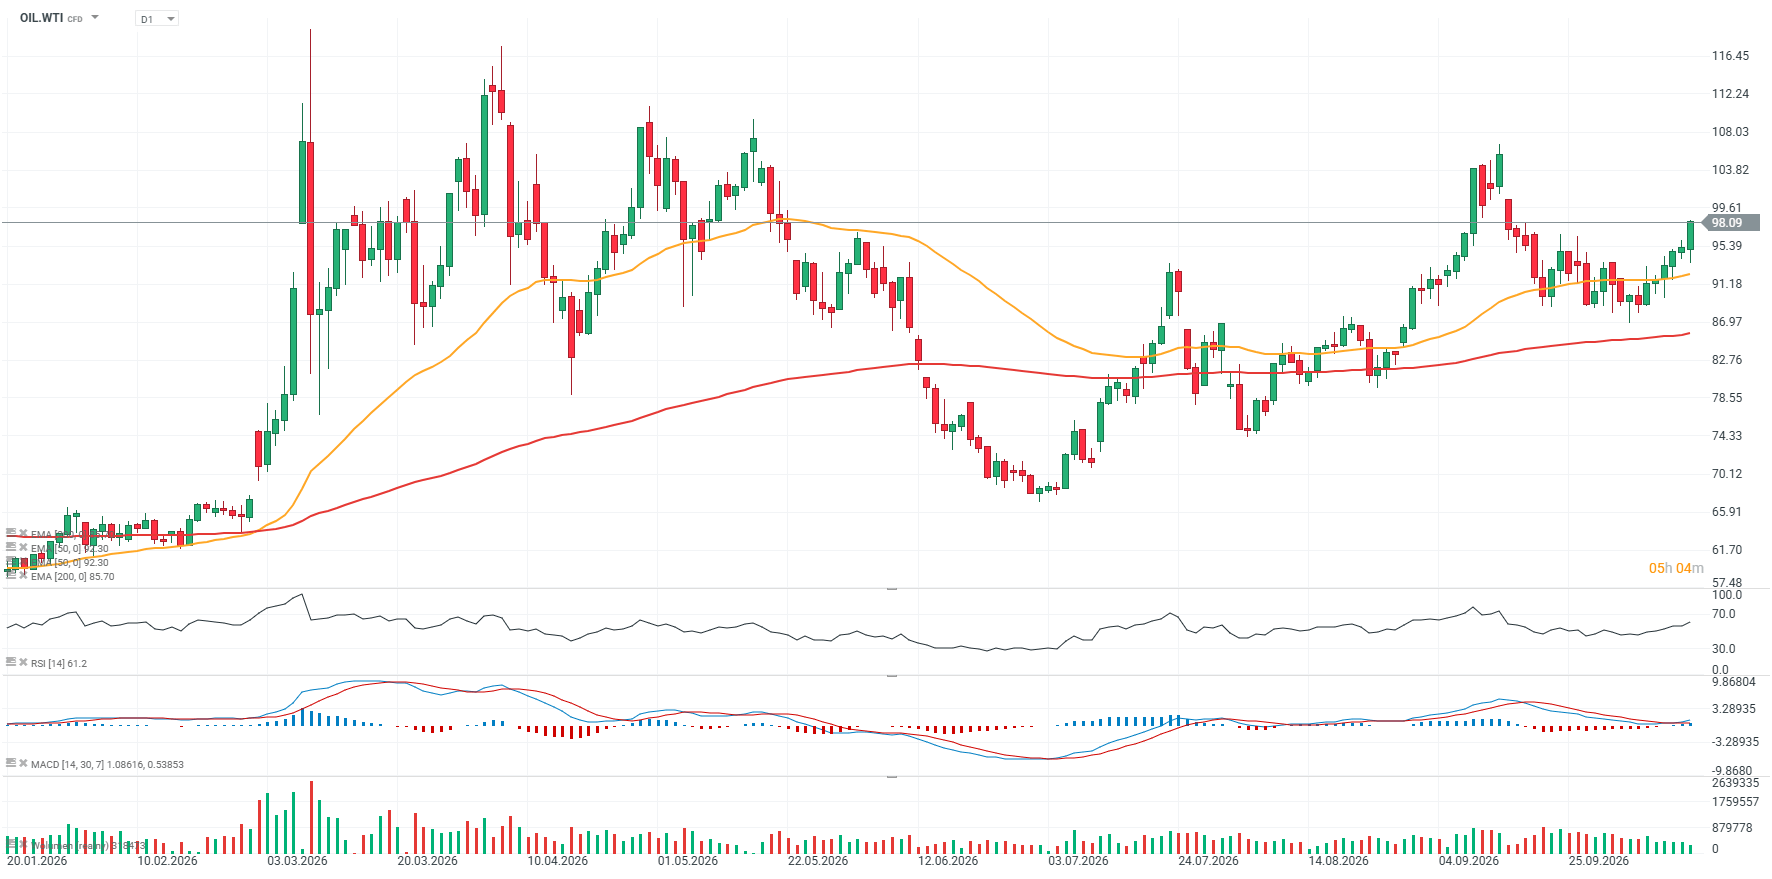
The latest EIA report reinforces a relatively supportive short-term picture for the U.S. oil market. Commercial crude inventories are now 3% below the five-year average for this time of year, while total commercial petroleum stocks fell by a substantial 13.4 million barrels, indicating that the broader inventory draw extended well beyond crude alone. Refinery activity remained strong, with crude inputs averaging 16.6 million barrels per day, up 135,000 bpd from the previous week, and utilisation reaching a high 93.5% of operable capacity. At the same time, crude imports fell sharply by 791,000 bpd to 6 million bpd, reducing the amount of foreign supply entering the domestic system and helping explain the larger-than-expected inventory draw. Gasoline production increased to an average of 9.2 million bpd, suggesting refiners are still responding to downstream demand despite already elevated utilisation rates. Taken together, the combination of lower inventories, reduced imports and strong refinery runs is fundamentally supportive for WTI, although the rise in gasoline stocks means the demand side of the report is not uniformly bullish.
OIL.WTI chart (D1 interval)
 Source: XTB



Market Wrap: Rebound in China and Falling Oil Prices, France Leads EU Declines



Optimism Returns to Asia❔


Morning Wrap: Nasdaq rebounds ahead of Mag7 earnings, bonds regain favour, oil falls from peak (19.10.2026)

Daily Summary: Friday offers no relief; the US100 drops 2%🚨
The material on this page does not constitute as financial advice and does not take into account your level of understanding, investment objectives, financial situation or any other particular needs.
All the information provided, including opinions, market research, mathematical results and technical analyses published on the website or transmitted to you by other means is provided for information purposes only and should in no event be interpreted as an offer of, or solicitation for, a transaction in any financial instrument, nor should the information provided be construed as advice of legal or fiscal nature.
Any investment decisions you make shall be based exclusively on your level of understanding, investment objectives, financial situation or any other particular needs. Any decision to act on information published on the website or transmitted to you by other means is entirely at your own risk. You are solely responsible for such decisions.
If you are in doubt or are not sure that you understand a particular product, instrument, service, or transaction, you should seek professional or legal advice before trading.
Investing in OTC Derivatives carries a high degree of risk, as they are leveraged based products and often small movements in the market could lead to much larger movements in the value of your investment and this could work against you or for you. Please ensure that you fully understand the risks involved, taking into account your investments objectives and level of experience, before trading, and if necessary, seek independent advice.