
The Q4 2025 earnings season on Wall Street is shaping up materially better than investors were expecting as recently as late December. With roughly one-third of S&P 500 companies already having reported, the picture is increasingly clear.
- According to FactSet data as of January 30, 2026, most companies are delivering results ahead of expectations, with a solid hit rate on both earnings and revenues.
- At the same time, revisions to 2026 earnings-per-share estimates are running above historical norms and are stronger than what we saw in 2025. This backdrop supports the bullish camp and strengthens the argument that the S&P 500 could return above the 7,000 level relatively quickly. Below, based on FactSet figures, we outline the key datapoints that help frame what this earnings season is really telling us.

Source: BofA Global Research
FactSet scorecard: results vs. expectations remain firmly positive
So far, about 75% of S&P 500 companies have beaten EPS forecasts, and 65% have surprised positively on revenue. That mix suggests expectations were set conservatively—particularly given persistent concerns around input costs and tariffs—while corporates, at least at this stage, are showing stronger operational resilience than the market priced in.
From an index-level perspective, the standout point is the blended year-over-year earnings growth rate of 11.9%. If that pace holds through the remainder of reporting season, the S&P 500 would log a fifth consecutive quarter of double-digit earnings growth—a strong signal that the earnings cycle continues to support equities.
Just a month earlier, on December 31, consensus implied 8.3% earnings growth for Q4—well below today’s ~11.9%. The gap highlights that this season is not merely “not disappointing”; it is actively pushing expectations higher. Importantly, this improvement is broad enough to show up at the sector level: six sectors are now tracking stronger earnings outcomes than they were at year-end, largely thanks to positive EPS surprises.
Net margins: the most striking feature of the season
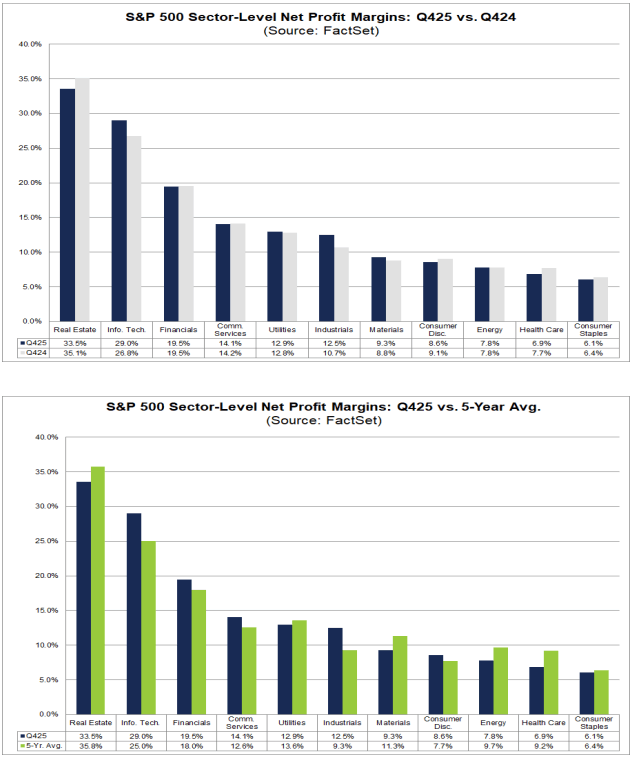
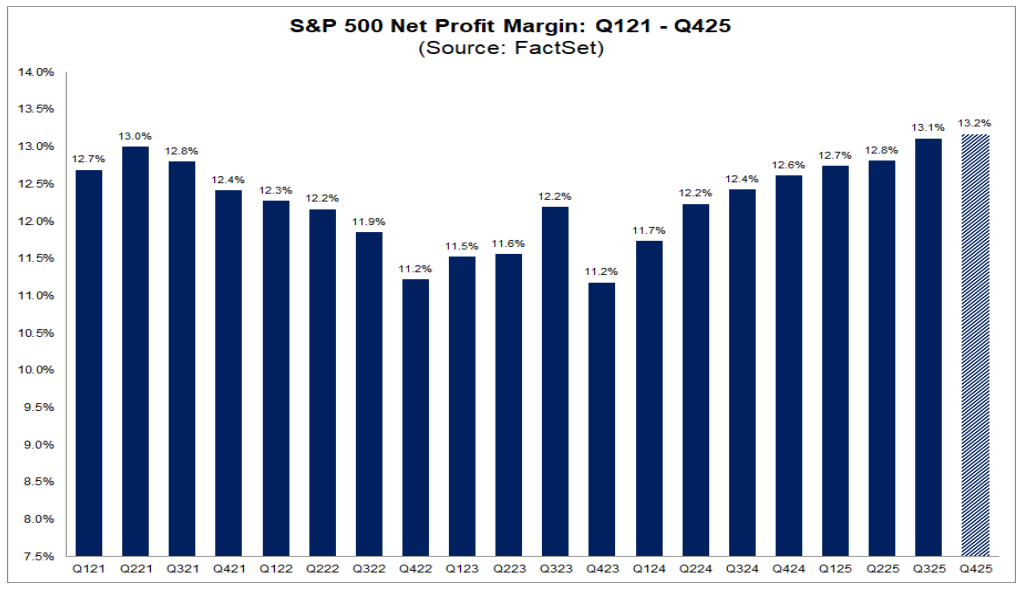
The most impressive element so far is profitability. Despite ongoing debates around tariffs, labor costs, logistics, and pricing pressure, the S&P 500 is currently reporting a blended net profit margin of 13.2% for Q4.
If that holds, it would represent the highest net profit margin recorded since FactSet began tracking this metric in 2009, edging out the prior record of 13.1%, which was set—remarkably—just last quarter. In other words, margins are not cracking under cost pressure; they are sitting at historic highs, challenging the narrative that costs are rapidly eroding corporate profitability.
Sector view: technology and industrials are doing the heavy lifting
On a year-over-year basis, margin expansion is concentrated—but where it shows up, it’s meaningful:
-
Information Technology has lifted net margins to 29.0% from 26.8%
-
Industrials has improved to 12.5% from 10.7%
On the other side of the ledger, multiple sectors are seeing margin compression. One of the clearest examples is Real Estate, where net margins have slipped to 33.5% from 35.1%. Energy is essentially flat year over year at 7.8%. It’s also worth noting that this is not a universal margin boom. Only five sectors are currently above their five-year average net margins, led again by Technology and Industrials, while sectors such as Health Care and Real Estate remain below their longer-term norms.
Source: FactSet
Quarter-on-quarter: mixed signals beneath the record headline
On a sequential basis (Q4 vs. Q3), the picture is more uneven. Only three sectors are expanding margins quarter over quarter, led by Industrials (12.5% vs. 10.5%). Most sectors are seeing sequential pressure, with Utilities among the largest drags (12.9% vs. 17.1%).
This suggests the record index-level margin is not the result of broad-based improvement everywhere; instead, it reflects the fact that a few large, highly profitable segments are maintaining exceptional profitability and carry enough weight to lift the aggregate S&P 500 number.
Q1 2026 guidance: constructive, but not euphoric
Company commentary on the next quarter looks steady rather than exuberant:
-
17 companies have issued positive EPS guidance
-
7 companies have issued negative EPS guidance
That’s not a “boom” signal, but it does imply management teams still see more room to execute than risk of a clear deterioration.
Valuation: investors are paying a premium for this earnings strength
The flip side is valuation. The S&P 500’s forward 12-month P/E is 22.2, which is meaningfully above both the:
-
5-year average (20.0)
-
10-year average (18.8)
The market is already paying up for sustained margin strength and continued earnings growth. Put differently: fundamentals are strong, but the tolerance for disappointment is limited—any earnings stumble later in the season could carry a larger price impact than it would in a lower-multiple environment.
Source: FactSet
2026 outlook: margins expected to climb even further
Consensus expectations imply margins could be even higher in 2026, with projected net profit margins around:
-
13.2% (Q1 2026)
-
13.8% (Q2 2026)
-
14.2% (Q3 2026)
-
14.2% (Q4 2026)
If the market can continue to deliver on that trajectory, high valuations may remain defensible—but it would require ongoing cost discipline and sustained pricing power. The key takeaway so far: Q4 2025 is shaping up as another quarter of solid earnings growth and record profitability, not a season defined by margin compression. The bigger risk for equities isn’t the earnings backdrop itself—it’s that, at current valuation levels, investors will demand near-perfect execution, especially heading into the 2026 quarters.
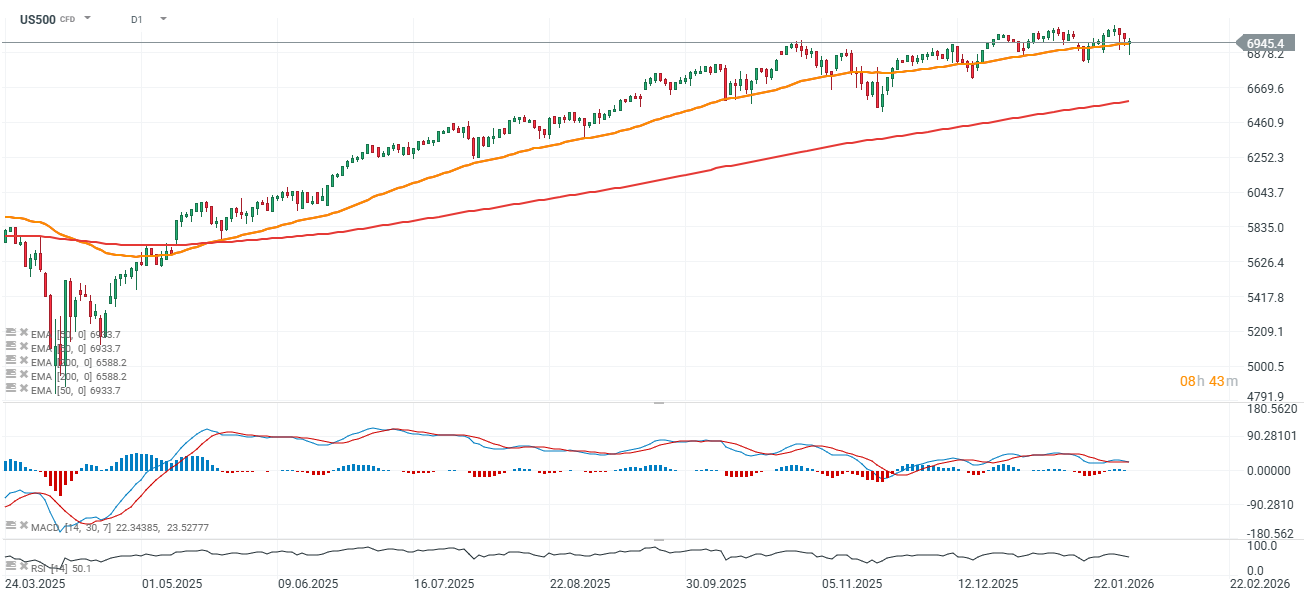
US500 technical snapshot (D1)
S&P 500 futures (US500) have quickly reclaimed the 50-day EMA on the daily chart and are once again hovering near 6,950. Strong earnings momentum continues to underpin the bullish narrative and helps offset negative momentum impulses.
Source: xStation5

US OPEN: The market calms down ahead of earnings season

BREAKING: US CPI higher, but below expectations! 🚨

🟡Gold returns to market-driven valuation over risk sentiment. What lies ahead for prices?

Chart of the Day: CH50cash – Chinese Equities on the Offensive (10.04.2026)
The material on this page does not constitute as financial advice and does not take into account your level of understanding, investment objectives, financial situation or any other particular needs.
All the information provided, including opinions, market research, mathematical results and technical analyses published on the website or transmitted to you by other means is provided for information purposes only and should in no event be interpreted as an offer of, or solicitation for, a transaction in any financial instrument, nor should the information provided be construed as advice of legal or fiscal nature.
Any investment decisions you make shall be based exclusively on your level of understanding, investment objectives, financial situation or any other particular needs. Any decision to act on information published on the website or transmitted to you by other means is entirely at your own risk. You are solely responsible for such decisions.
If you are in doubt or are not sure that you understand a particular product, instrument, service, or transaction, you should seek professional or legal advice before trading.
Investing in OTC Derivatives carries a high degree of risk, as they are leveraged based products and often small movements in the market could lead to much larger movements in the value of your investment and this could work against you or for you. Please ensure that you fully understand the risks involved, taking into account your investments objectives and level of experience, before trading, and if necessary, seek independent advice.