
Today at 1:30 PM BST, the CPI inflation data for the USA was released. The August report turned out to be relatively optimistic for the headline measure (2.5% year-over-year, below the expectations of 2.6% year-over-year). However, the core inflation measure negatively surprised the markets. Although the annual rate matched expectations at 3.2% year-over-year, the monthly change was slightly higher at 0.3% month-over-month compared to expectations of 0.2% month-over-month.
Over the past two weeks, the market has been speculating whether the Fed at its meeting on September 18 will cut interest rates by 25 basis points or by 50 basis points. At this moment, it seems that the data suggest a smaller rate cut. In the initial reaction after the data release, the dollar index strengthened sharply, and the EURUSD briefly tested the 1.1000 levels. We observed strong increases in bond yields, and the stock market was predominantly selling off. Currently, the chances of a 50 basis point rate cut are just 15-17%, compared to about 50% a week ago before the labor market data was published.
This year, the market still prices in a chance of 100 basis points of easing by the Fed, so cuts are very much in play. Contrary to appearances, the data may be positively received by the FOMC members, due to the dynamics of individual components of the basket. We invite you to a detailed analysis of the report based on the latest data.
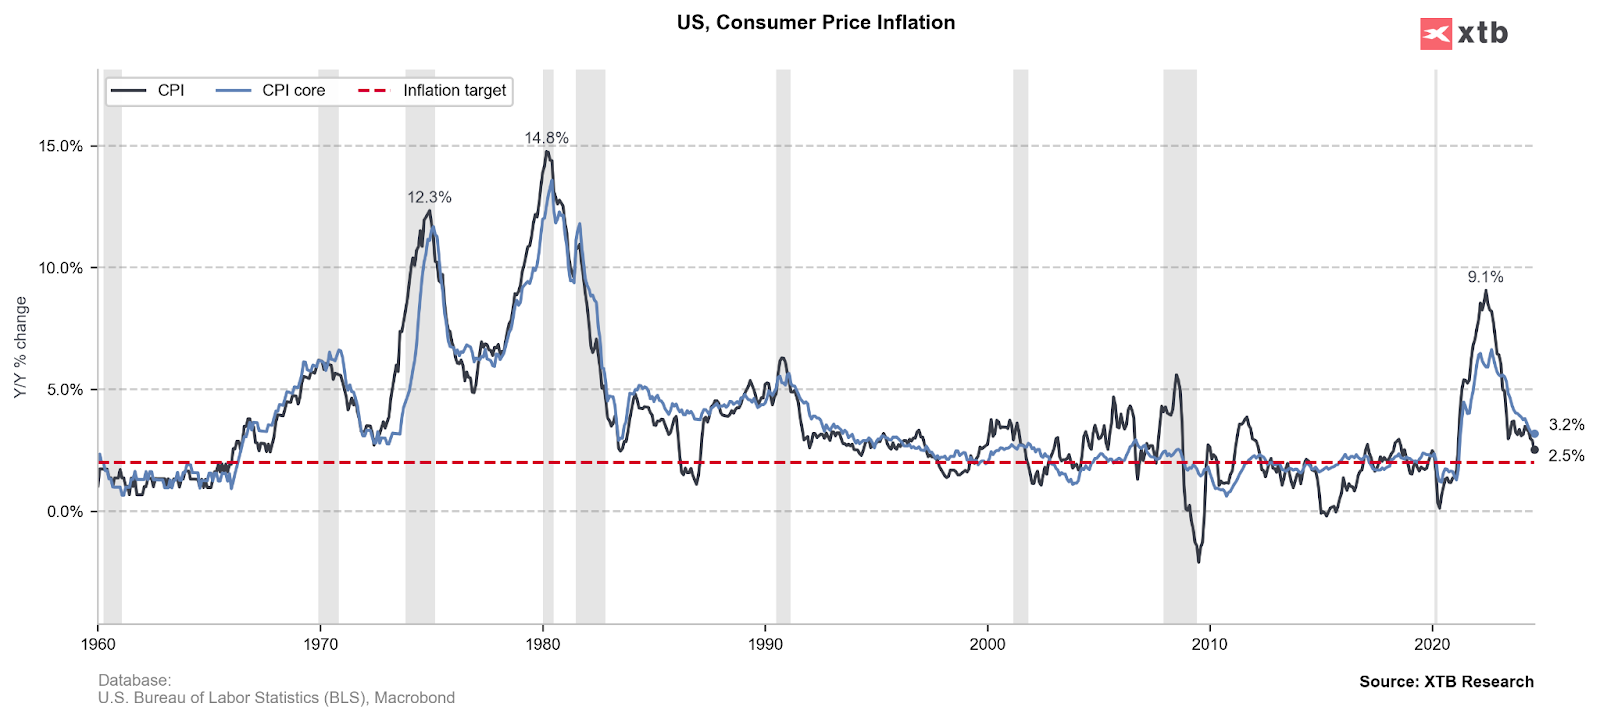
Main and Core Inflation
The dynamics of main inflation are quite satisfying. A reading of 2.5% is very close to the Fed's inflation target and within the upper ranges of readings from the last several years. The core inflation (excluding energy and food prices), however, remains at a high level.
Why does core inflation remain high?
Upon closer examination of the detailed components of inflation, we can see that many contributions remained even in deflation. The largest and practically only component remaining high are housing rental prices. It was an unexpected increase in this sector that caused the rebound in core inflation. In the case of main inflation, rental housing prices were partially offset by the negative dynamics of energy prices.
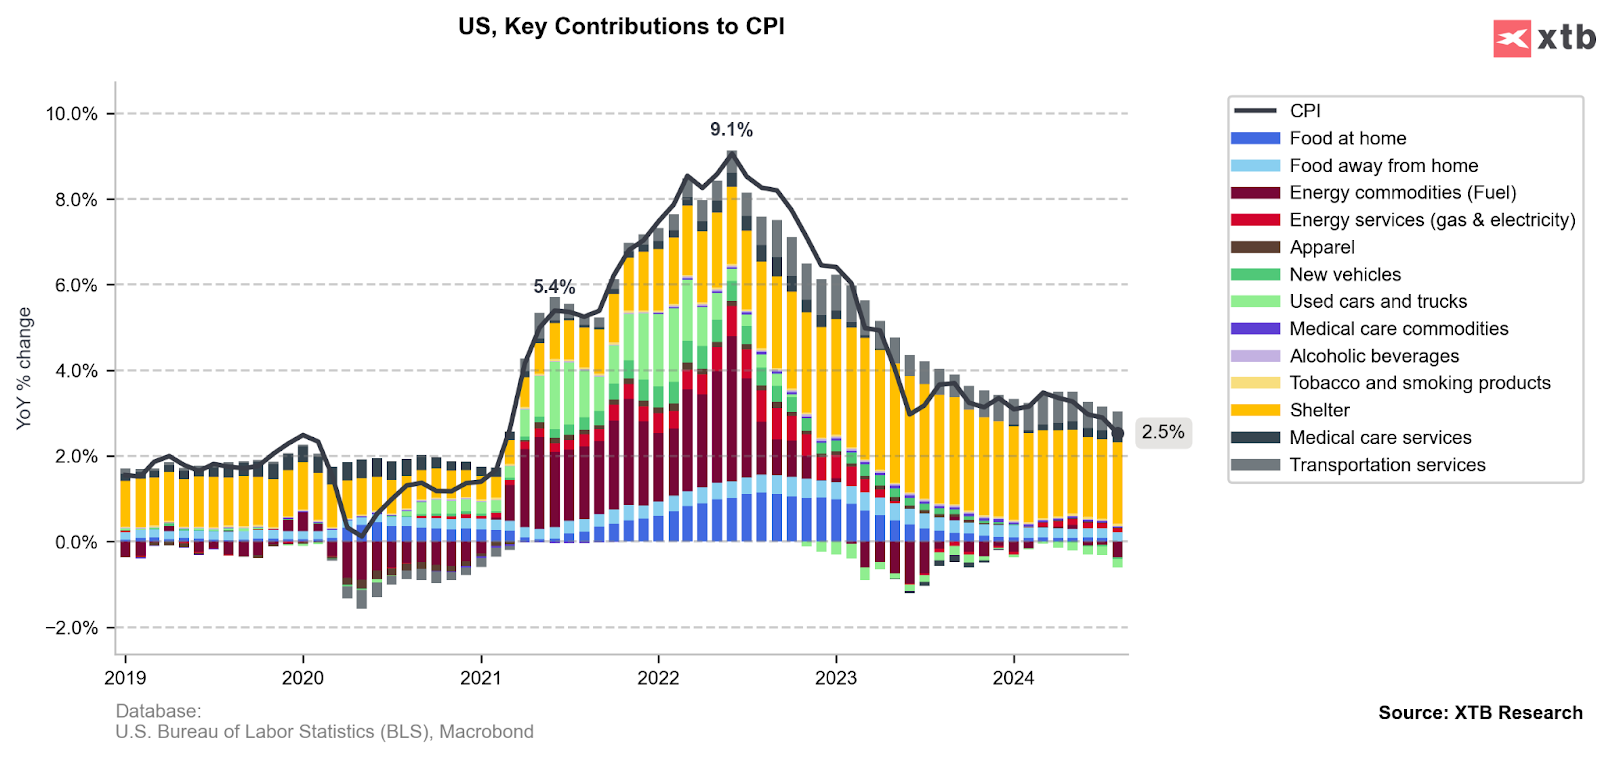
Rental housing prices account for as much as 1.9% of the 2.5% CPI reading. An equally important positive contribution is transportation service prices, which added another 0.5% to the final main CPI measure.

Shelter prices rebound slightly. However, a high correlation with the Case Shiller home price data indicates that today's reading is probably a one-time deviation from the long-term downward trend.

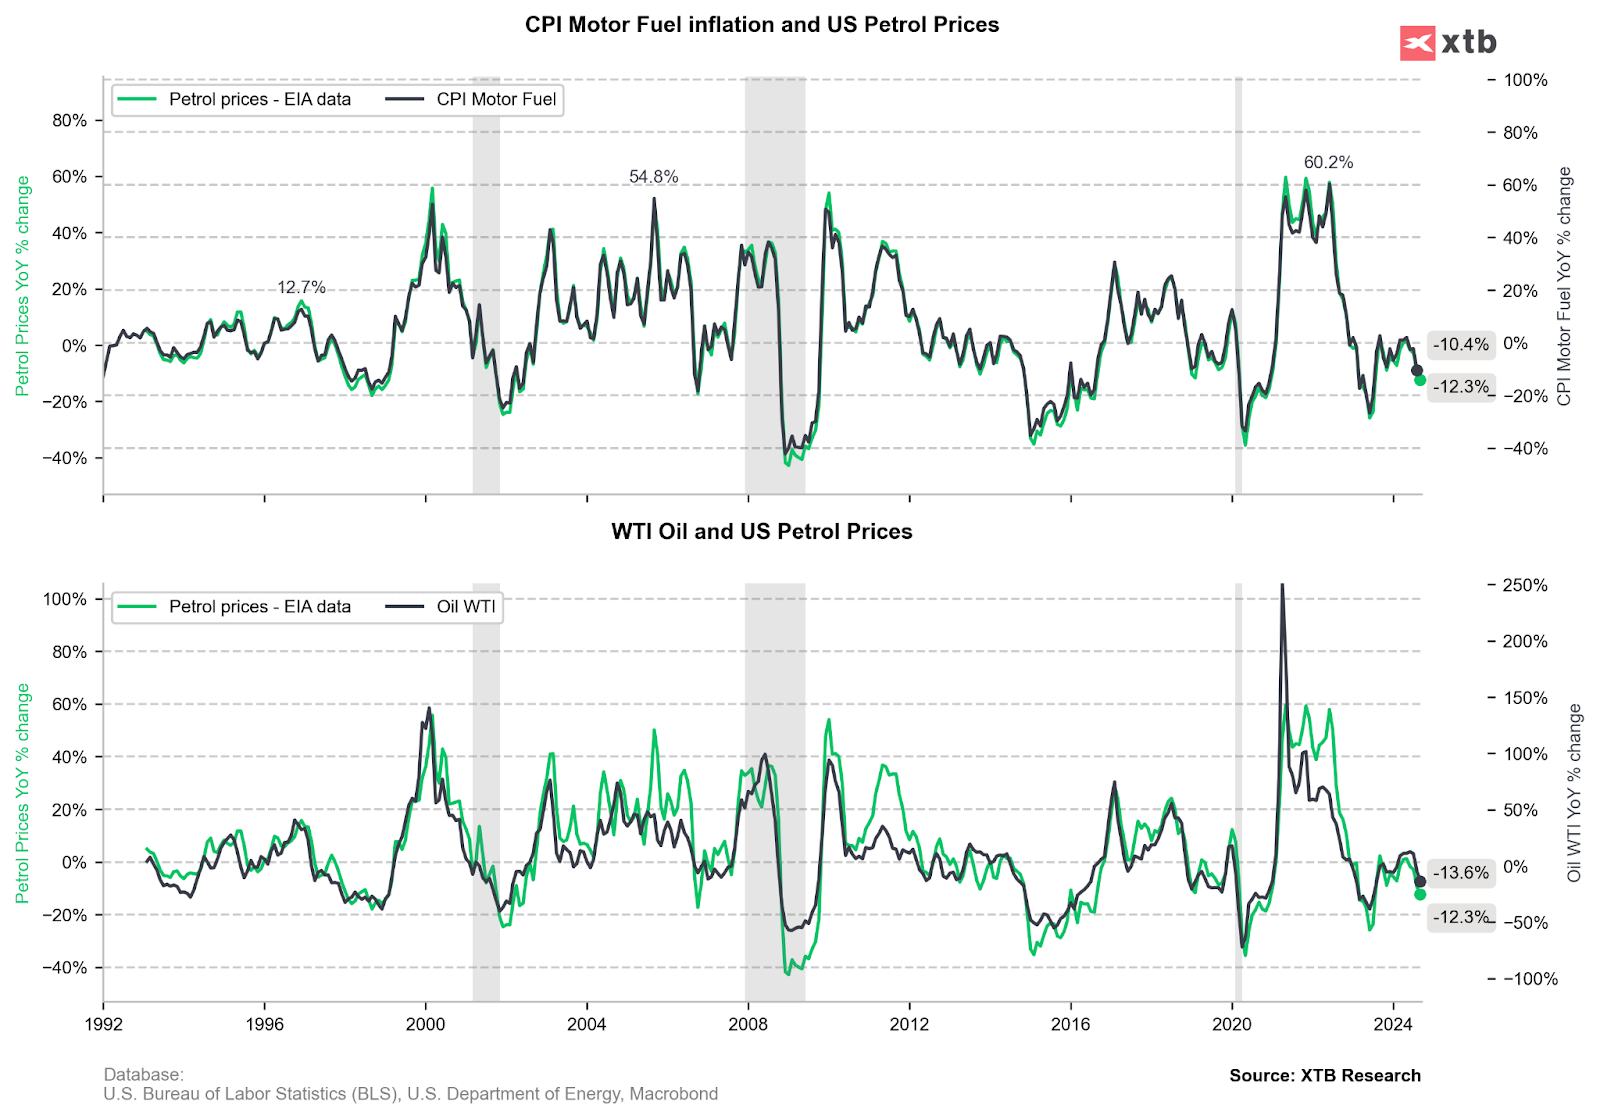
Did oil save the report?
Oil prices fell sharply throughout August, and concerns about an economic slowdown also maintain these declines in September. Energy prices reduced inflation by a total of 0.37%. Based on the data from the chart below, the declines in oil prices are continuing, which means increasingly cheaper fuels.
How might the Fed receive the report?
The report might turn out to be relatively good for the Fed. Although core inflation may have disappointed, its basis is not in broad services, as it has been so far, but mainly in rental housing prices. This sector of the inflation basket is not related to the demand side and is significantly delayed relative to the rest of the segments. Meanwhile, strong deflation in services plus the deflationary pressure from fuel prices give the Fed full green light to start easing monetary policy next week. The cut will most likely be 25 basis points, in line with the Fed's so far transparent communication.

BREAKING: US PMIs beat estimates 📈 Stocks back in the green

💶European PMI Plunges as Iran Conflict Batters Economic Activity

Economic Calendar: PMI in Focus, a Key Day for Global Markets
➡️EURUSD Amid European Stagflation and Geopolitical Shock
The material on this page does not constitute as financial advice and does not take into account your level of understanding, investment objectives, financial situation or any other particular needs.
All the information provided, including opinions, market research, mathematical results and technical analyses published on the website or transmitted to you by other means is provided for information purposes only and should in no event be interpreted as an offer of, or solicitation for, a transaction in any financial instrument, nor should the information provided be construed as advice of legal or fiscal nature.
Any investment decisions you make shall be based exclusively on your level of understanding, investment objectives, financial situation or any other particular needs. Any decision to act on information published on the website or transmitted to you by other means is entirely at your own risk. You are solely responsible for such decisions.
If you are in doubt or are not sure that you understand a particular product, instrument, service, or transaction, you should seek professional or legal advice before trading.
Investing in OTC Derivatives carries a high degree of risk, as they are leveraged based products and often small movements in the market could lead to much larger movements in the value of your investment and this could work against you or for you. Please ensure that you fully understand the risks involved, taking into account your investments objectives and level of experience, before trading, and if necessary, seek independent advice.