-
Silver Hits $50 Mark: Silver is up over 4%, fighting for a historic close above $50 after yesterday's record peak.
-
Bullish Signal: The gold-to-silver ratio is falling, suggesting strong potential upside for silver, with technicals not yet indicating extreme overbought levels.
-
Key Levels: Watch for resistance at $55/oz and support at $45/oz in the event of a correction.
-
Silver Hits $50 Mark: Silver is up over 4%, fighting for a historic close above $50 after yesterday's record peak.
-
Bullish Signal: The gold-to-silver ratio is falling, suggesting strong potential upside for silver, with technicals not yet indicating extreme overbought levels.
-
Key Levels: Watch for resistance at $55/oz and support at $45/oz in the event of a correction.
Yesterday, silver established a new all-time high, surpassing the peaks seen in the early 1980s and 2011. Crucially, however, it failed to secure a close above $50 per ounce. While gold saw a stronger correction yesterday, silver began Friday morning with robust gains. These advances have accelerated to over 3.5%, with the metal now trading around $50.90 per ounce, setting the stage for a potentially record-breaking closing price.
Technical Indicators and Historical Context
Examining silver’s current levels and its deviations from key averages, we observe that gold is expensive by historical standards, but not yet extremely so. Typically, a strong overvaluation of silver is indicated by a fivefold deviation from its five-year moving average, a 4-4.5 deviation from its one-year average, and a threefold deviation from its 100-day average.
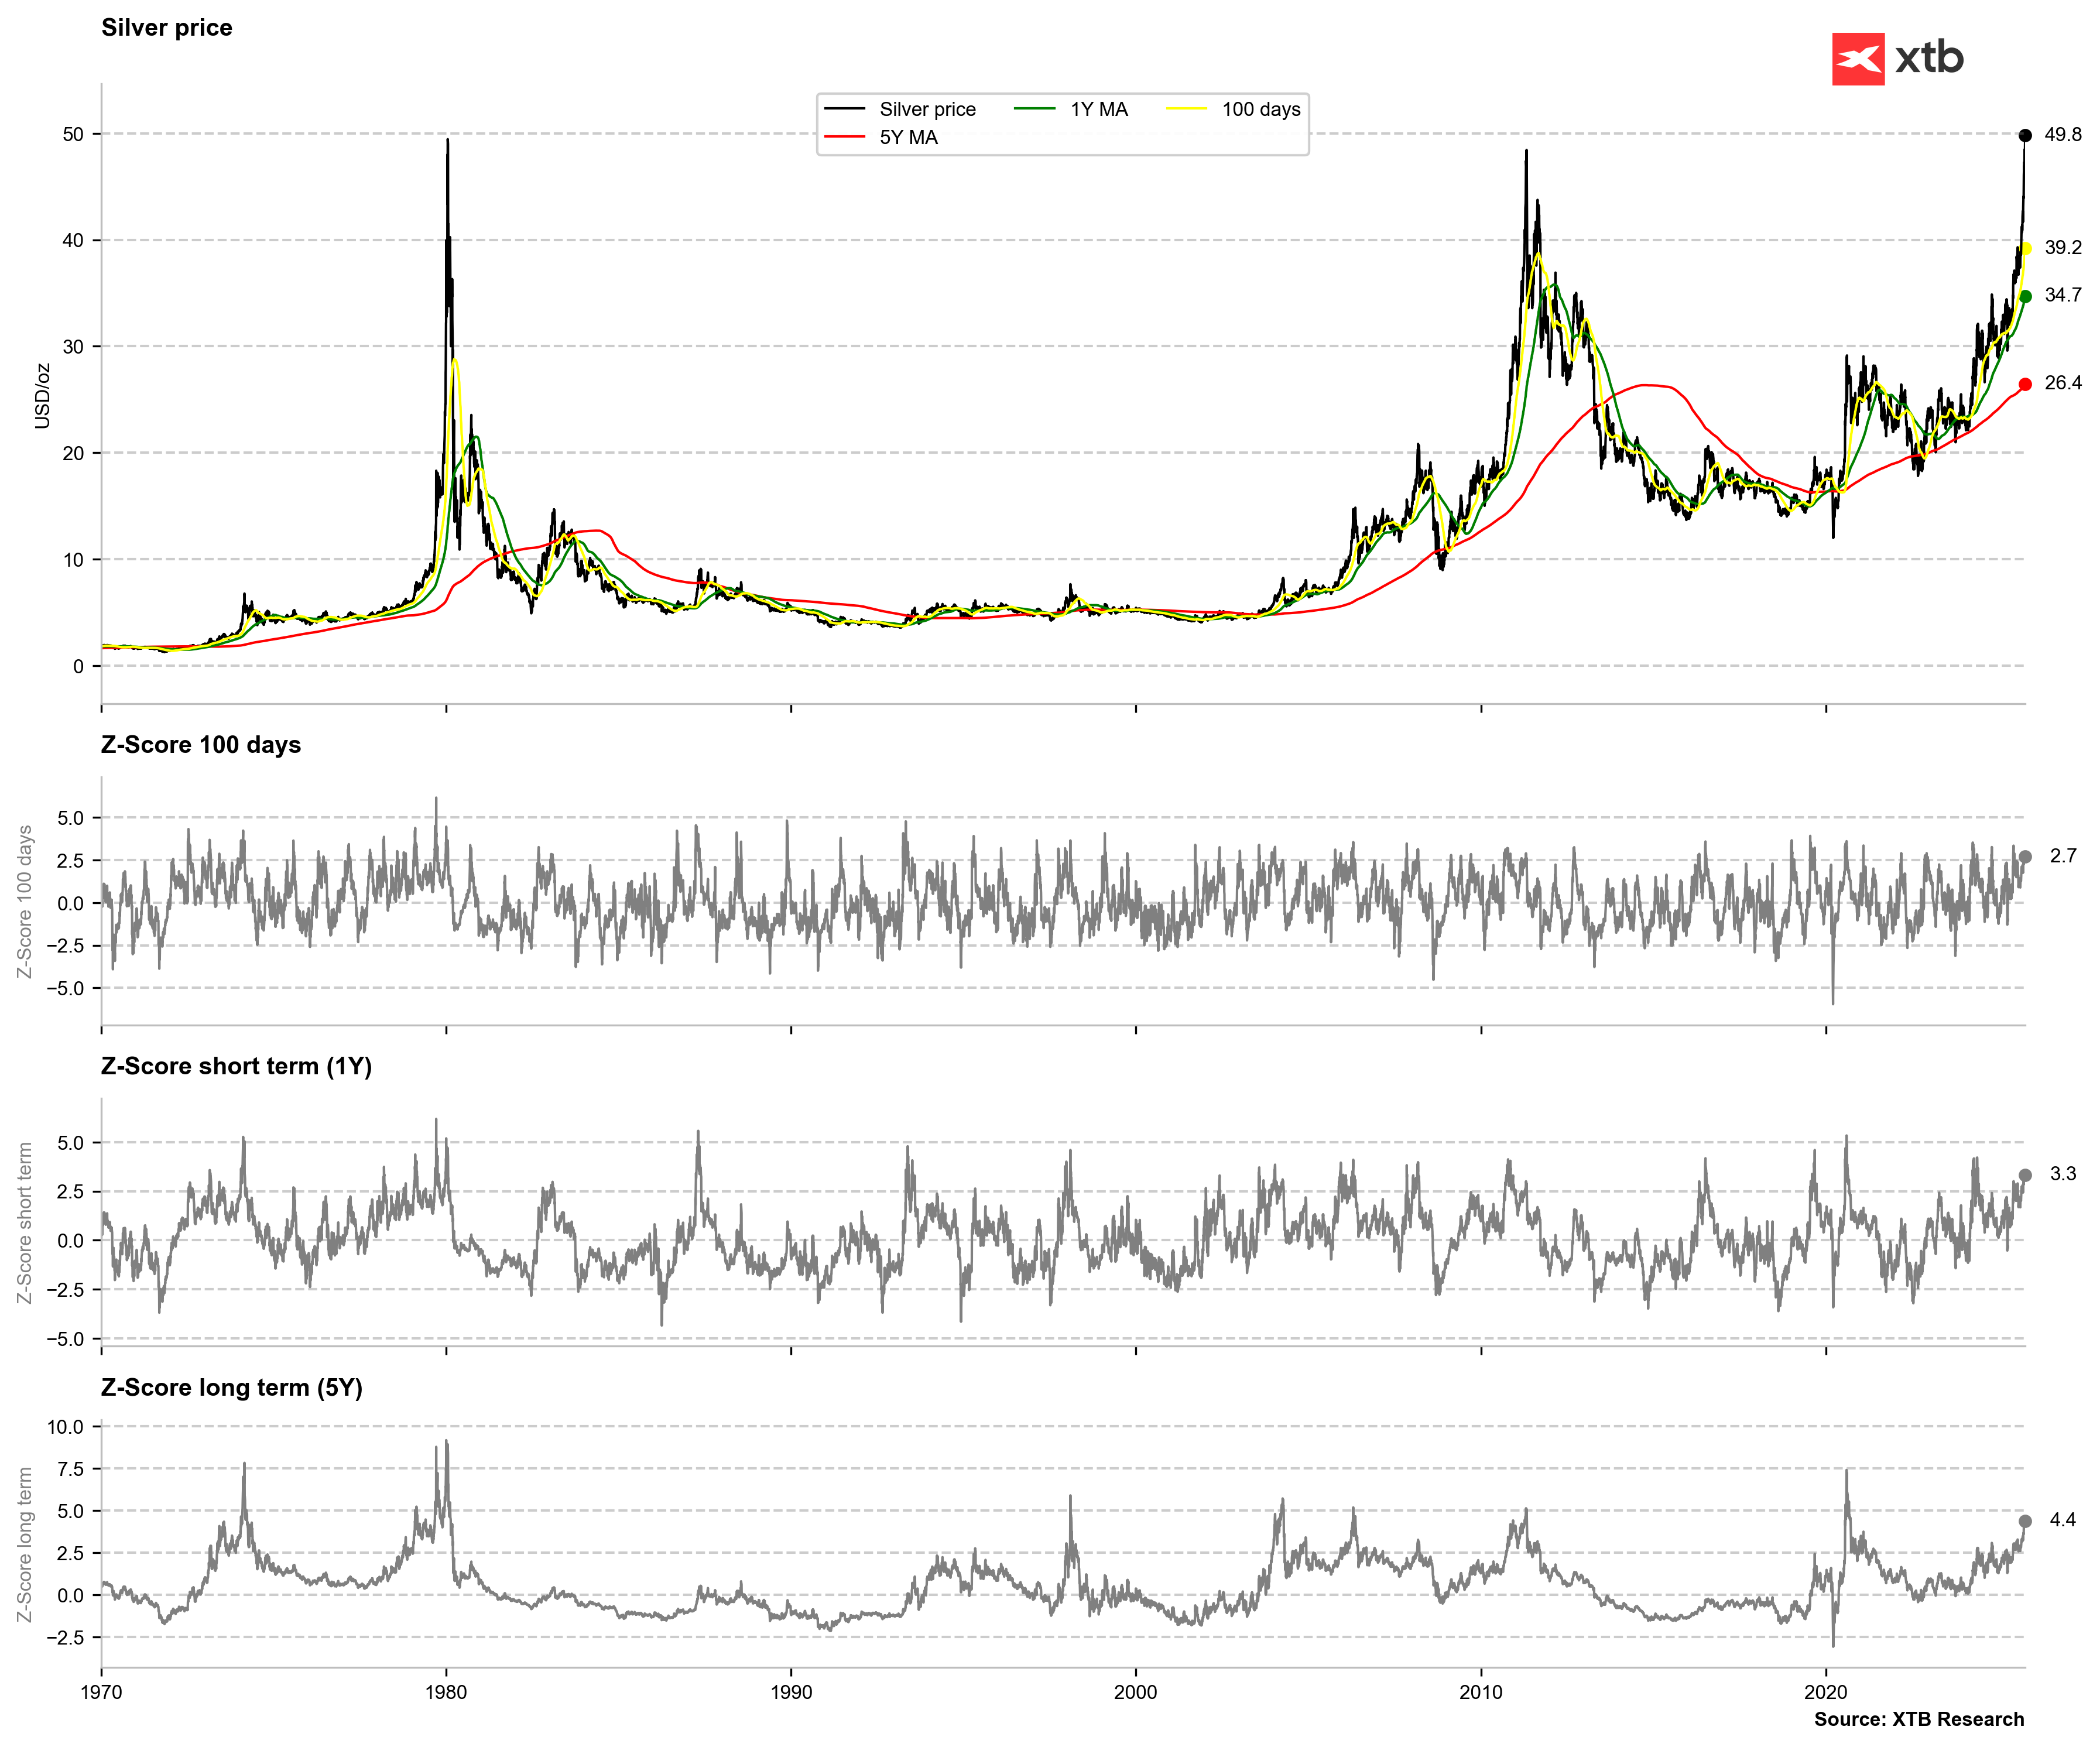
Silver is currently expensive, but strong technical overbought signals are not yet present. Source: Bloomberg Finance LP, XTB
Looking at the gold-to-silver ratio, we are seeing a drop below the 10-year average. In recent years, the ratio has rarely fallen below this average. However, if the bull phase in the precious metals market is not yet over, it is worth recalling the beginning of the previous decade when silver also approached $50 per ounce and the ratio plunged significantly below its average. In 2011, it even fell below the long-term average range of 50–53 points.
Assuming gold could reach $4,200 in the coming months and the ratio could fall to 70 points, this would imply a valuation of $60 per ounce for silver. Conversely, this ratio works both ways: in a decline, silver typically falls faster than gold. A 10% correction from current gold levels would imply $3,600 for gold. If the ratio were to rise to 90, silver would be valued at $40.
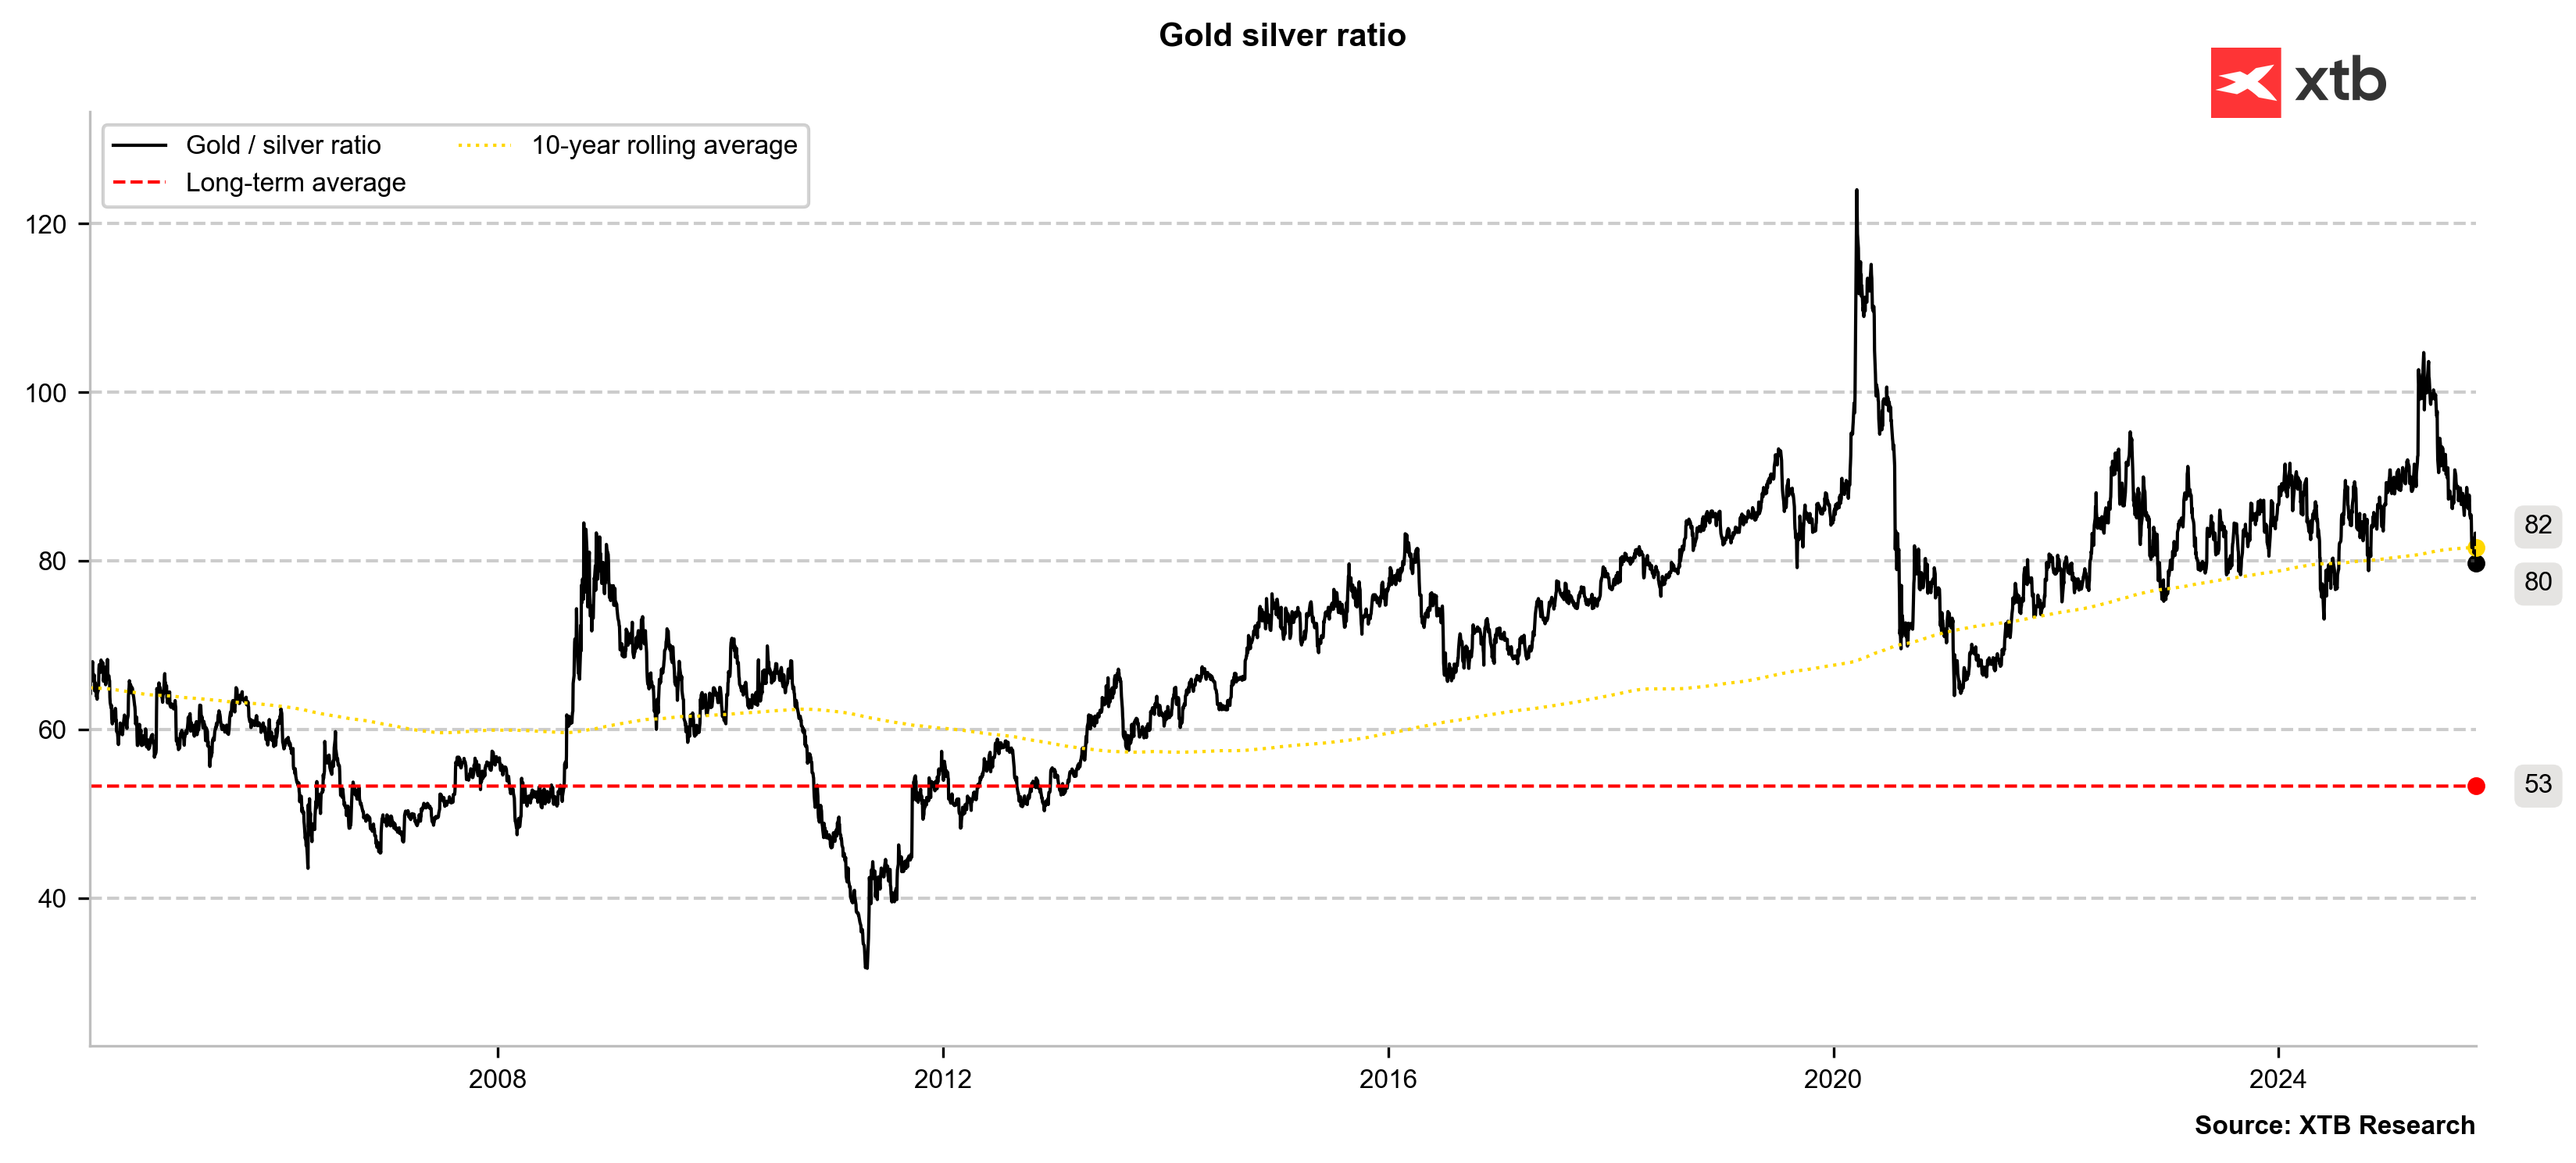
The gold-to-silver ratio is falling below 80 points, which, if the precious metals rally continues, may signal an extremely bullish outlook for silver. However, as has been the case over the past four years, it could also be a short-term indicator of silver overvaluation. Source: Bloomberg Finance LP, XTB
Outlook and Key Levels
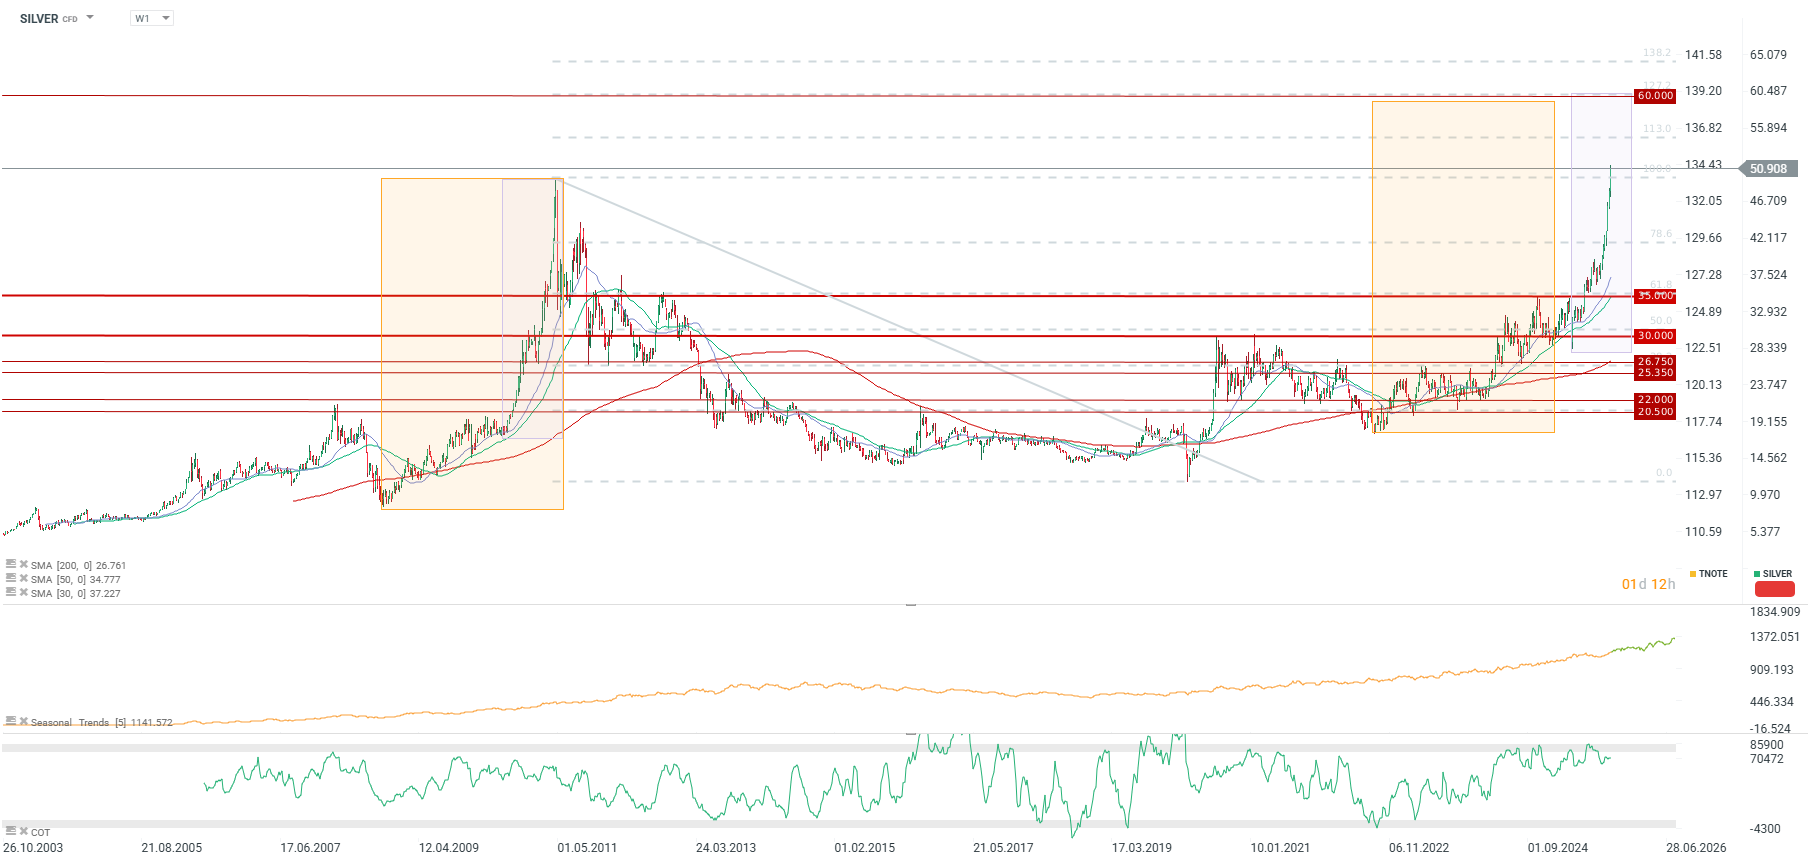
Silver is up over 4%, nearly matching yesterday's session records. Assuming the silver bull run is not over, the strong movement ranges from 2011 imply potential targets of $59–$60 for the metal. The nearest strong resistance, based on the 113% Fibonacci extension, is around $55 per ounce. In the event of a correction, support should be sought near $45 per ounce, which aligns with the 23.6% retracement of the entire uptrend wave that began in April and may be culminating near current levels.

Daily summary: AI optimism, Nvidia stock surge & second round of US - Iran talks drive optimism on Wall Street

📌Oil slips below $100

⚡ Will US drought fuel speculative grain volatility on CBOT?
🔴Three markets to watch next week: all eyes on the Fed (24.04.2026)
The material on this page does not constitute as financial advice and does not take into account your level of understanding, investment objectives, financial situation or any other particular needs.
All the information provided, including opinions, market research, mathematical results and technical analyses published on the website or transmitted to you by other means is provided for information purposes only and should in no event be interpreted as an offer of, or solicitation for, a transaction in any financial instrument, nor should the information provided be construed as advice of legal or fiscal nature.
Any investment decisions you make shall be based exclusively on your level of understanding, investment objectives, financial situation or any other particular needs. Any decision to act on information published on the website or transmitted to you by other means is entirely at your own risk. You are solely responsible for such decisions.
If you are in doubt or are not sure that you understand a particular product, instrument, service, or transaction, you should seek professional or legal advice before trading.
Investing in OTC Derivatives carries a high degree of risk, as they are leveraged based products and often small movements in the market could lead to much larger movements in the value of your investment and this could work against you or for you. Please ensure that you fully understand the risks involved, taking into account your investments objectives and level of experience, before trading, and if necessary, seek independent advice.