
Cryptocurrencies have been gaining momentum in recent days. Let’s have a look at Bitcoin’s technical situation. Taking a look at the daily interval, one might notice that the price successfully broke above the key resistance area near $41,000. The zone was marked with 1:1 structure (red boxes) and previous price actions. Smashing through the mentioned resistance and the downward trend line may actually lead to the sentiment reversal. Should the upward move continue, the area near $47,000 could be the next key resistance (50% Fibonacci retracement of the sell-off started in April and previous local lows).
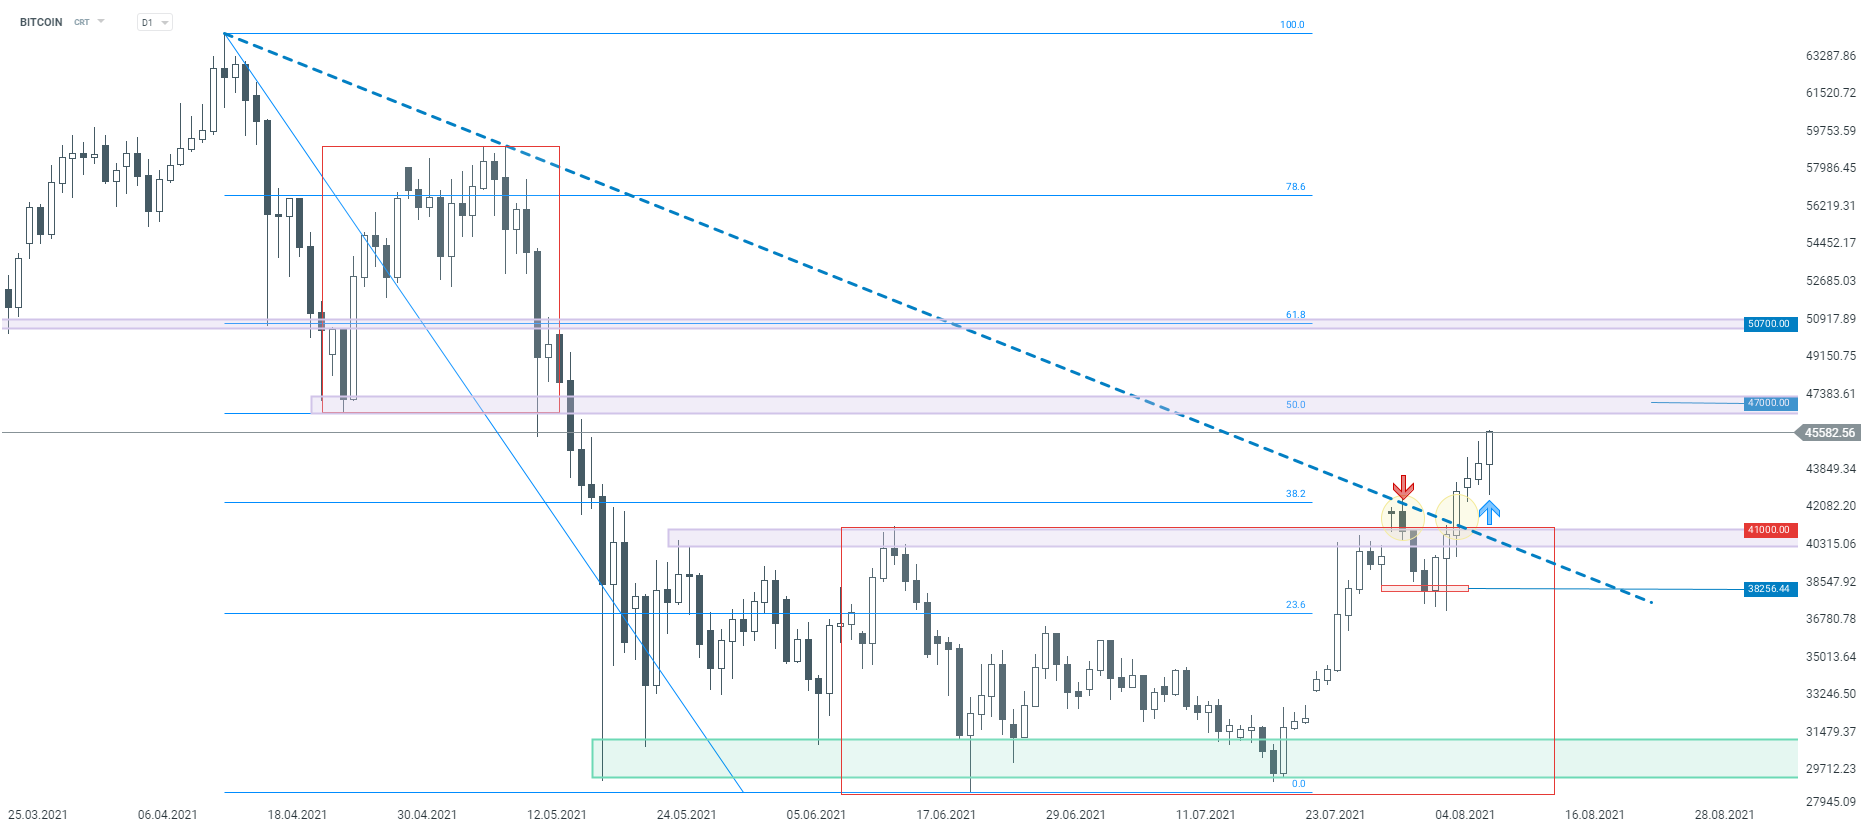 Bitcoin, daily interval. Source: xStation5

Resumen diario: Las amenazas de guerra de Trump presionan a los mercados. Wall Street se hunde en terreno negativo

Cierre de mercado: Alphabet supera expectativas, pero no logra convencer al mercado

Bitcoin alcanza su nivel más alto en un mes

Mercados a Observar Hoy: Bitcoin, Copper y AUDJPY (21.07.2026)
"Este informe se proporciona sólo con fines de información general y con fines educativos. Cualquier opinión, análisis, precio u otro contenido no constituyen asesoramiento de inversión o recomendación en entendimiento de la ley de Belice. El rendimiento en el pasado no indica necesariamente los resultados futuros, y cualquier persona que actúe sobre esta información lo hace bajo su propio riesgo. XTB no aceptará responsabilidad por ninguna pérdida o daño, incluida, sin limitación, cualquier pérdida de beneficio, que pueda surgir directa o indirectamente del uso o la confianza de dicha información. Los contratos por diferencias (""CFDs"") son productos con apalancamiento y acarrean un alto nivel de riesgo. Asegúrese de comprender los riesgos asociados. "