


- Silver is falling by nearly 3% today to around 47.3 USD per ounce, testing October 2025 lows.
- The market prices in a 92% chance of a December Fed rate hike, strengthening the US dollar.
- Global silver demand is forecast to fall by 5% in 2026, shifting the market to a modest surplus.
- Technical indicators show oversold conditions, but the overall trend remains firmly downward.

- Silver is falling by nearly 3% today to around 47.3 USD per ounce, testing October 2025 lows.
- The market prices in a 92% chance of a December Fed rate hike, strengthening the US dollar.
- Global silver demand is forecast to fall by 5% in 2026, shifting the market to a modest surplus.
- Technical indicators show oversold conditions, but the overall trend remains firmly downward.
Silver is falling by nearly 3% today, to around 47.3 USD per ounce, testing the October 2025 lows zone. In a week, the precious metal has lost 11.3%, in a month 16.9%, and from January's record (around 120 USD) already about 61%. Since the beginning of the year, the price has dropped by 34.8%. The entire precious metals sector is performing poorly: gold fell to around 3840 USD, the lowest level in over a year. The market prices in a 92% chance of a December Fed rate hike, and the US dollar is at its strongest level since April 2025.
Fed and the dollar sap momentum
Monetary policy is putting heavy pressure on gold and silver. October CPI rose by 0.4% m/m, above expectations, and while PPI slowed to 0.3%, the September reading was revised upwards. Fed officials are sounding increasingly hawkish. Jeff Schmid assesses that inflation is still "too hot", John Williams points to the need for further tightening, and Philip Jefferson declares he is guided by inflation data. According to FedWatch, the market prices in a 92% probability of a 25 bps rate hike in December, and an 8% chance of a 50 bps move. Higher interest rates increase the opportunity cost of holding precious metals, which yield no interest. Additionally, a strong US dollar makes metals more expensive for non-US investors, weighing on demand particularly in China and India, where demand is highest. Today, the market awaits Fed Chair Kevin Warsh's speech, and on Wednesday, the minutes from the October FOMC meeting.
Although the picture is currently grim for precious metals, falling oil prices might unlock a scenario of a final interest rate hike, which would suggest the market is close to a potential bottom. On the other hand, fundamental conditions continue to deteriorate.
Fundamentals: the deficit disappears
The Silver Institute and Metals Focus forecast that global silver demand will fall in 2026 by 5%, to 1.08 billion ounces:
- Industrial demand -3%: fewer solar installations, especially in China, while January price records accelerated the substitution of silver in photovoltaic cells.
- Jewelry -22%, silverware -17%: high prices and weaker demand in rural India.
- Bars and coins -2%: US retail investments at their lowest since 2010.
- ETP funds: an outflow of 45 million ounces following inflows of 278 million in 2025.
The most significant shift concerns the market balance. Factoring in ETPs (ETFs), the market transitions from a 332 million ounce deficit in 2025 to a modest surplus of 10 million ounces in 2026. The narrative of a chronic silver shortage, which drove last year's bull market, is currently losing traction, even though earlier this year there were fears of insufficient silver reserves for all buyers. However, positioning does not indicate panic. Funds hold a net long position of around 21k contracts, corresponding to the 37th percentile historically. Speculative capital is therefore cautious, but not set up for aggressive declines. On an annual basis, silver is nearly 2 standard deviations below its mean, while on a 5-year basis it remains slightly over 0.5 standard deviations above it. Silver is thus cheap relative to the past year, but not in a long-term perspective.
Technical analysis
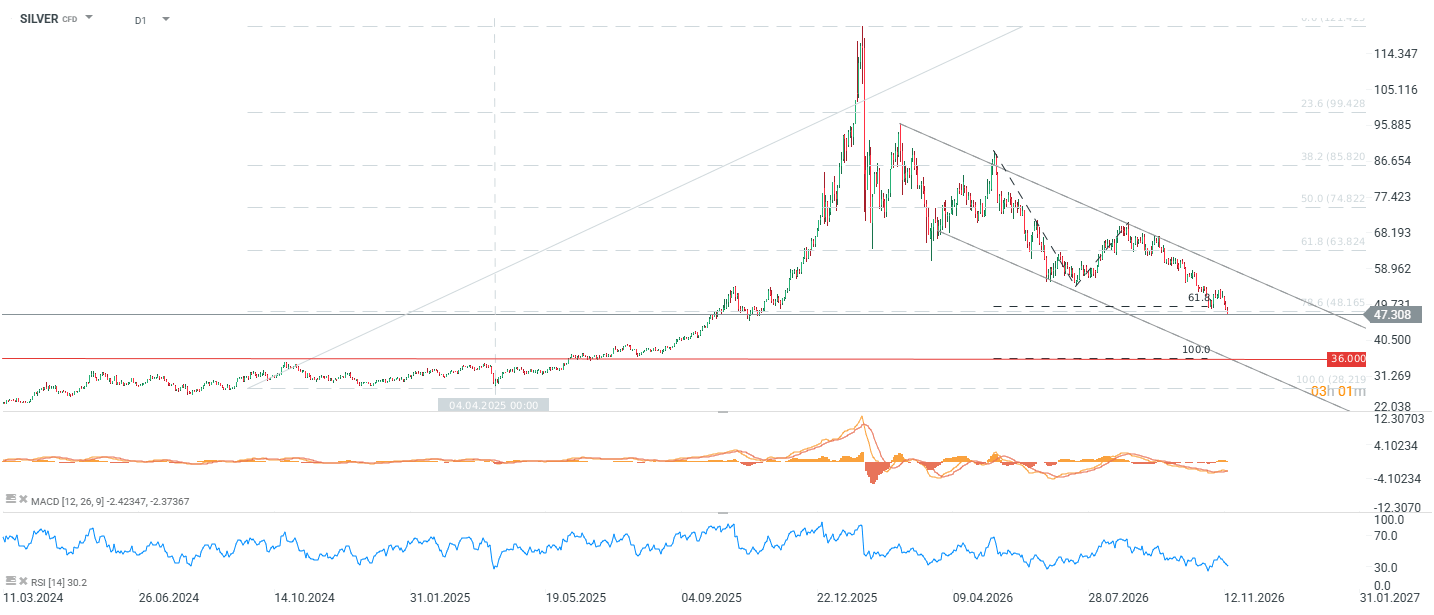
Since the peak at the turn of the year, silver has been moving in a downward channel, with every rebound (February, April, August) ending in a lower high. Price dropped below the 78.6% retracement of the entire 2025 upward wave (48.17 USD), and in recent sessions broke through the 61.8% expansion of the latest downward leg. It is now testing the 45–47 USD region, which marks the October 2025 lows. This is the last key support before a deeper gap. If it fails to hold, the 1:1 Fibonacci expansion projection points to 36 USD, which served as resistance in 2024–2025 before turning into support upon breaking out. Along the way lies the lower channel boundary around 41–42 USD.
RSI(14) fell to 30.2, bordering on oversold territory, and the price sits 18.2% below its 50-session moving average. MACD remains negative with no signal of a reversal yet. The extent of oversold conditions increases the likelihood of a technical rebound, but the overall trend remains firmly downward.
Silver ratio: silver remains relatively expensive
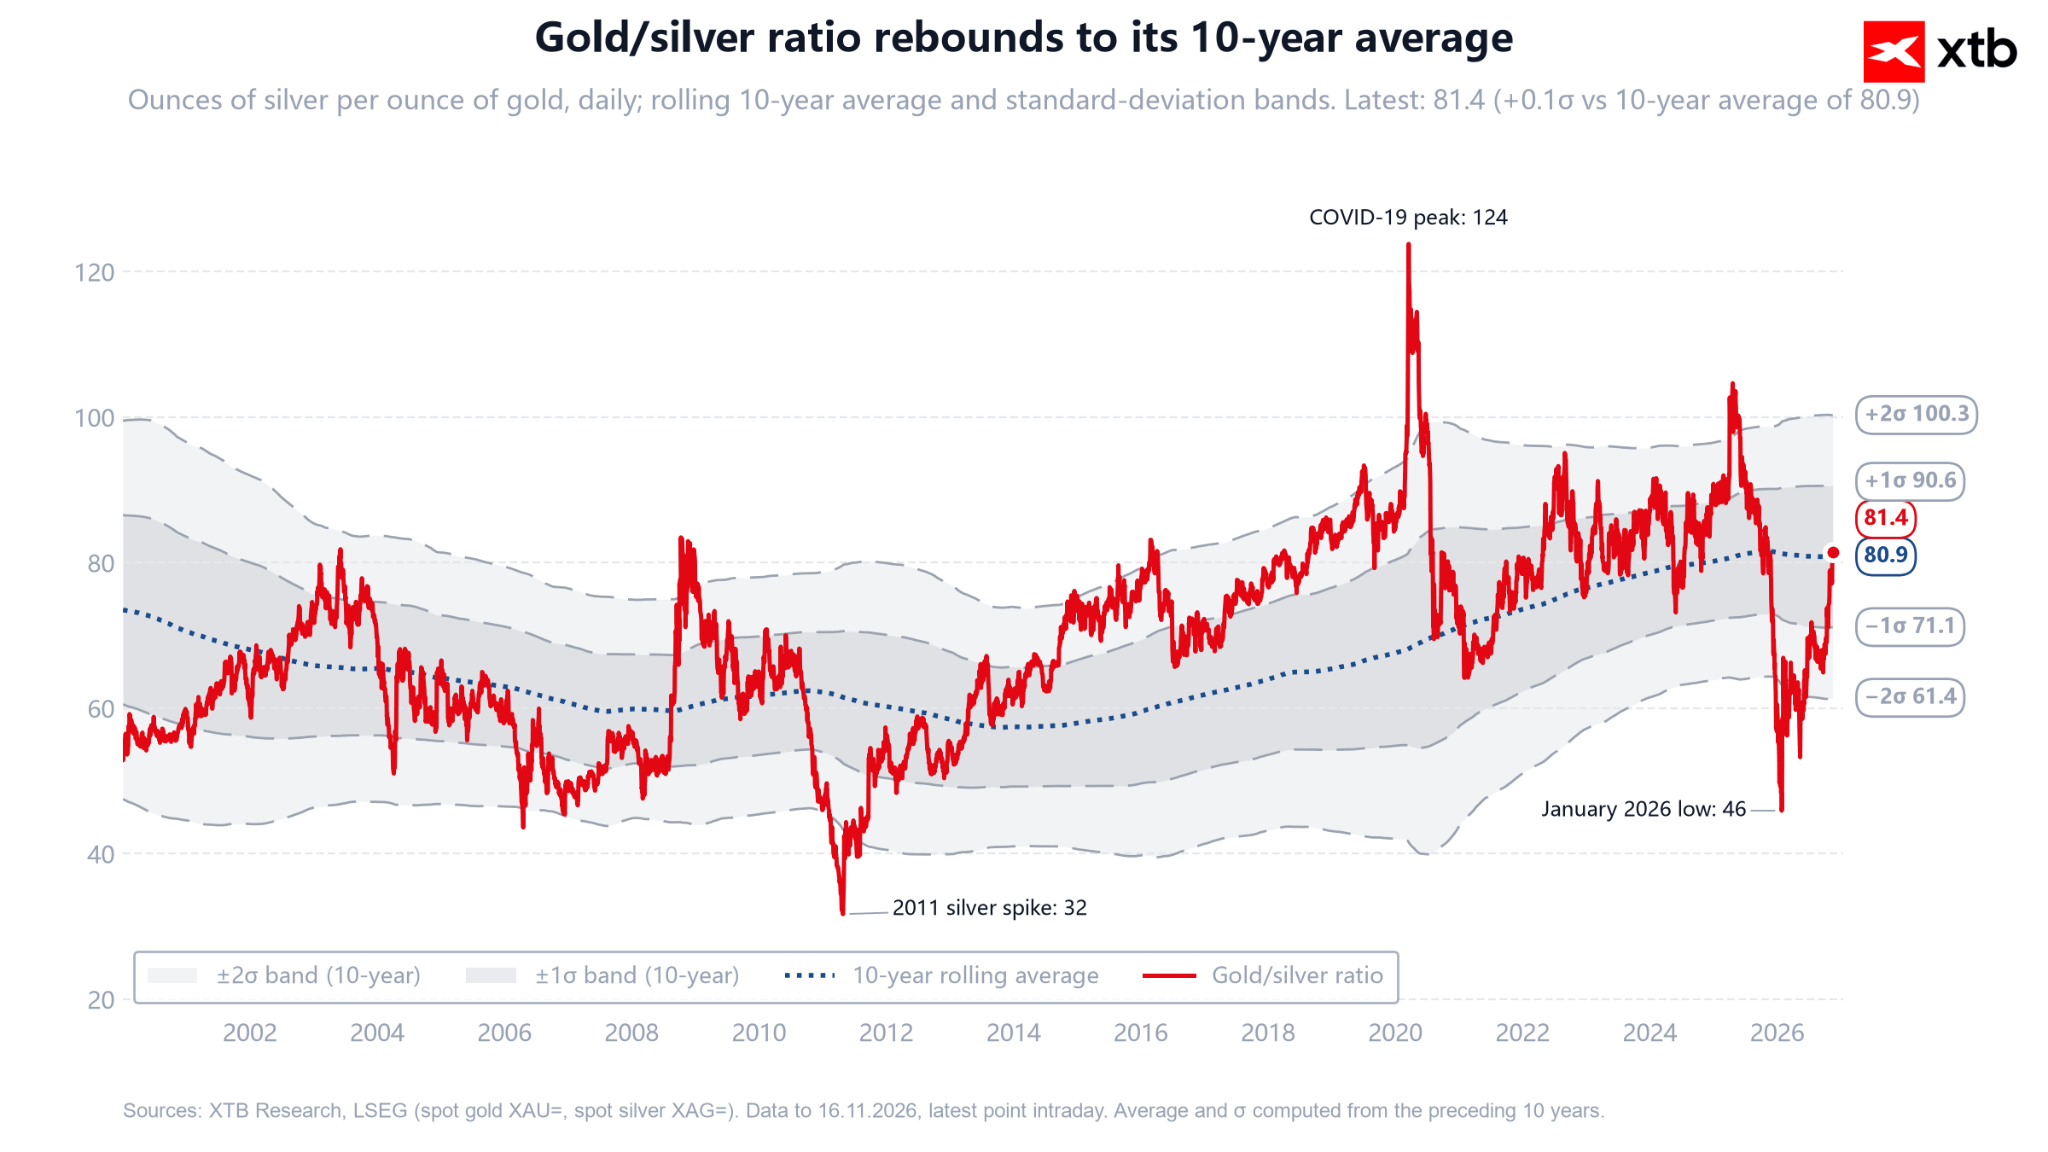
With gold around 3840 USD, the gold/silver ratio stands at approximately 81. From the perspective of the 10-year moving average, silver is fairly valued relative to gold. On the other hand, a return to 90 (near the 2020–2024 average) would imply a silver price of about 42.7 USD given current gold prices, coinciding with the lower channel boundary. A slide to 36 USD would require a ratio near 107 with gold unchanged, or further gold declines with the ratio around 90 (gold around 3240 USD). The silver ratio thus confirms downside risks toward 41–43 USD, but reaching 36 USD would necessitate broader weakness across the entire precious metals sector, rather than silver underperforming alone.
Conclusion
Silver rests at its last key support around 45–46 USD, while all main headwinds remain active: a hawkish Fed, the strongest US dollar in a year and a half, softening demand, and the dissipation of the physical deficit. Oversold indicators (RSI 30, 1-year z-score near -2) and cautious rather than extreme fund positioning open the door for a technical rebound toward 50 USD. However, a trend reversal requires a shift in the Fed narrative. Should Warsh and Wednesday's FOMC minutes confirm a hawkish stance, and the 45 USD area breaks down, the path toward 41–42 USD, and ultimately 36 USD, will open up.



Daily Summary: Tech Stock Selloff Weighs on Markets, Fed Outlines AI Scenarios

European gas drops 6% and tests key support


Market Wrap: Weak data from Europe and Asia, market awaits Warsh


Economic Calendar – Weaker data from Asia, tensions in the Strait of Hormuz, and inflation from Canada
The material on this page does not constitute as financial advice and does not take into account your level of understanding, investment objectives, financial situation or any other particular needs.
All the information provided, including opinions, market research, mathematical results and technical analyses published on the website or transmitted to you by other means is provided for information purposes only and should in no event be interpreted as an offer of, or solicitation for, a transaction in any financial instrument, nor should the information provided be construed as advice of legal or fiscal nature.
Any investment decisions you make shall be based exclusively on your level of understanding, investment objectives, financial situation or any other particular needs. Any decision to act on information published on the website or transmitted to you by other means is entirely at your own risk. You are solely responsible for such decisions.
If you are in doubt or are not sure that you understand a particular product, instrument, service, or transaction, you should seek professional or legal advice before trading.
Investing in OTC Derivatives carries a high degree of risk, as they are leveraged based products and often small movements in the market could lead to much larger movements in the value of your investment and this could work against you or for you. Please ensure that you fully understand the risks involved, taking into account your investments objectives and level of experience, before trading, and if necessary, seek independent advice.