
France remains the leader of the luxury goods market. Previously supported by strong expansion, throughout Asia, the sector’s companies are still affected by mutations caused by the pandemic. Actually, the brands must contend with changes in consumption methods, forcing them to innovate while remaining true to their DNA. They did it well, which led LVMH (MC.FR) and L’Oreal (OR.FR) shares to new ATH, while Hermes (RMS.FR) and Kering (KER.FR) are very close to their highest level. The Luxury sector helped CAC40 (FRA40) recover from its pre-pandemic lows, given that the four companies submentionned represent 35% of the french index.
Most of european indices finished yesterday’s trading higher, German Dax (DE30) broke above the psychological level at 15 000 pts thus establishing a new historic high, while CAC40 (FRA40) jumped 1,2% at 6088 pts. It was in fact the strongest trading session for the CAC40 since february 2020, but this time it was thanks to the Banking sector taking advantage from the US 10-Year Treasury yield hitting its highest level since January last year. Société Générale (GLE.FR) gained 3,96% BNP Paribas (BNP.FR) finished 3,85% and Crédit Agricole (ACA.FR) moved 2,72%.
In this analysis, we will focus on three intervals to find out the perspective of the FRA40, actually close to its record high.
Weekly interval :
In a weekly perspective, the Ichimoku bullish signal was given in November last year, when prices managed to break the cloud (red circle). When the Chikou-span confirmed the bullish signal by breaking the cloud at the end of february (red box), the upward resumed to reach 6070 pts near record high. The pre-pandemic high is the next resistance, if bulls manage to take prices higher, the door will be open for new records.
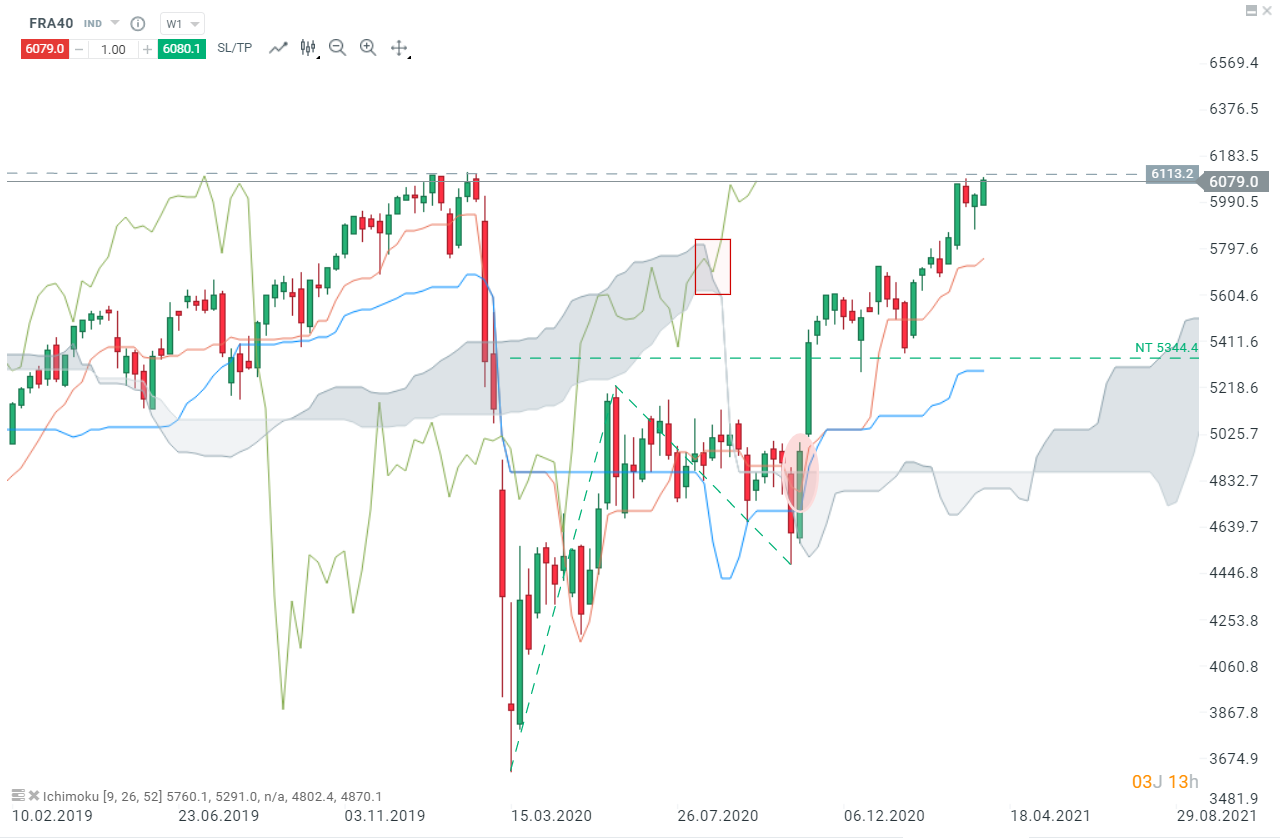
FRA40, W1 interval. Source : xStation5
Daily interval :
Looking at the daily interval, one can see that a first downward correction occurred after prices bounced on 5 700 pts resistance. This correction reached the daily cloud (first red circle), acting like a support and allowed prices to bounce with a stronger momentum and break above the sub mentioned resistance. After a new upward move starting in the beginning of march, prices met a new resistance level around 6090 pts, and bounced off this resistance. Bulls managed to halt declines at the Kijun-line (second red circle), around 5 887 pts and now prices are back to the previous resistance, last barrier before record high. Should buyers manage to break above it, an upward move may accelerate to the 127,2% exterior retracement at 6150 pts. On the other hand, if the price stays below 6090 pts, a downward correction may occur to the 78,6% Fibonacci retracement, around 6050 pts.
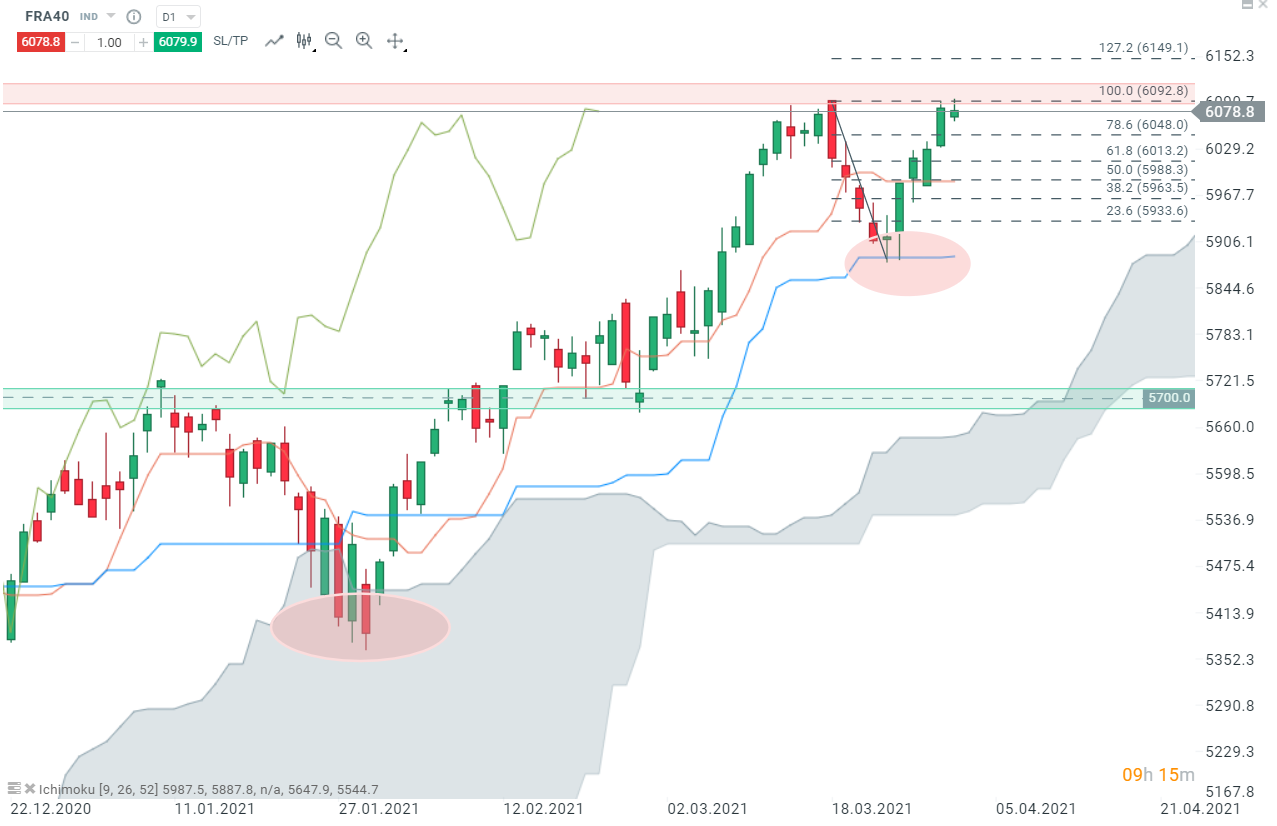 FRA40, D1 interval, Source : xStation5
H4 interval :
In this interval, we can notice that bulls managed to halt declines at the lower side of the cloud (yellow box), around 5 890 pts, the daily Kijun-line mentioned earlier. As we can see, if a downward correction occurs, the next support is the Tenkan-line (red circle), which coincides with the 78,6% retracement at 6050 pts. Red area on the chart below represents a key support, if price drops below this level, we could see a deeper correction to 5 700 pts. On the other hand, should today’s or tomorrow’s daily candlestick close above 6091 pts, a bigger upward move may be on the card, which could lead to a new ATH.
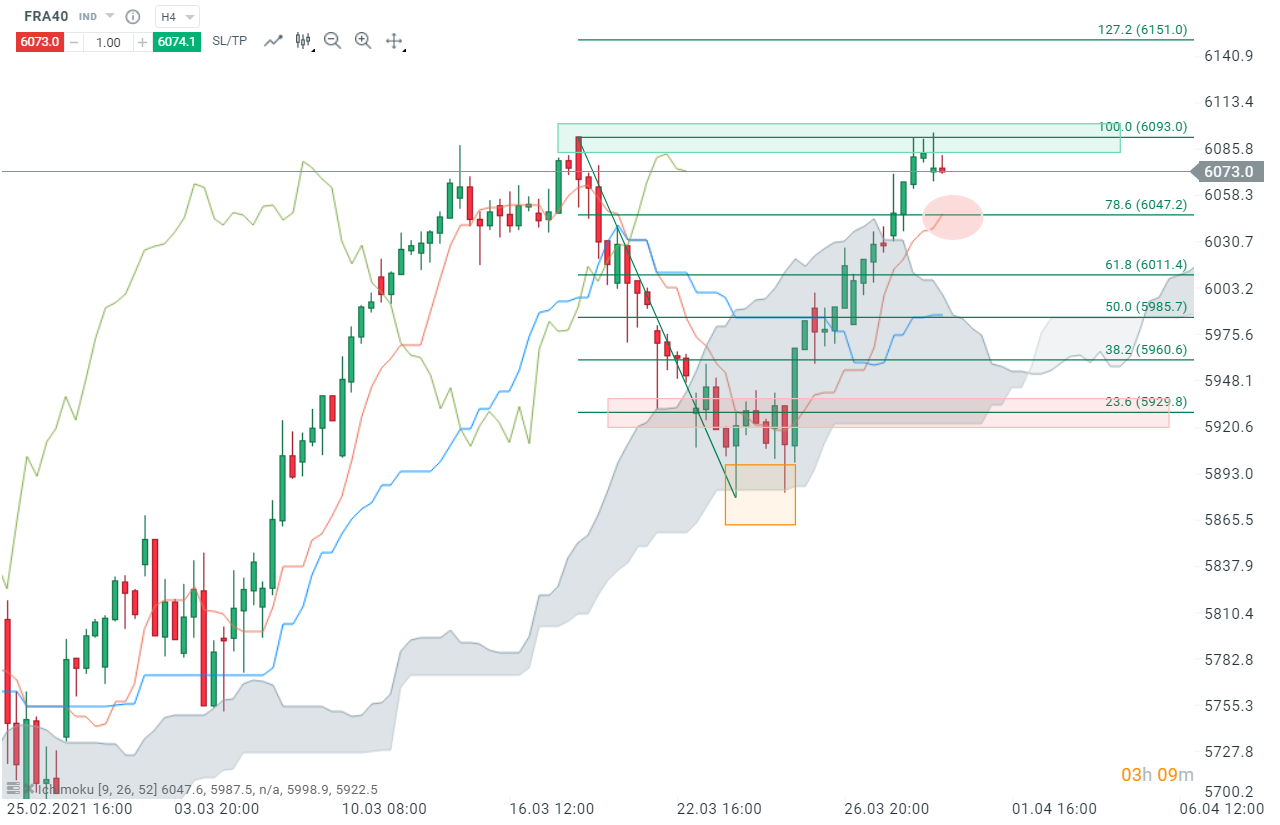
FRA40, H4 interval, Source : xStation5
Réda Aboutika, XTB France

La bolsa hoy: El precio del petróleo se desploma un 7% 💥

La Fed y las grandes tecnológicas ponen a prueba el mercado: los eventos clave de la semana

Resultados corporativos: Alphabet e Intel crecen con la IA mientras Tesla pierde impulso

Petróleo sobre US$100, gas europeo bajo presión y nuevos aranceles: ¿qué mueve al mercado?
"Este informe se proporciona sólo con fines de información general y con fines educativos. Cualquier opinión, análisis, precio u otro contenido no constituyen asesoramiento de inversión o recomendación en entendimiento de la ley de Belice. El rendimiento en el pasado no indica necesariamente los resultados futuros, y cualquier persona que actúe sobre esta información lo hace bajo su propio riesgo. XTB no aceptará responsabilidad por ninguna pérdida o daño, incluida, sin limitación, cualquier pérdida de beneficio, que pueda surgir directa o indirectamente del uso o la confianza de dicha información. Los contratos por diferencias (""CFDs"") son productos con apalancamiento y acarrean un alto nivel de riesgo. Asegúrese de comprender los riesgos asociados. "