



Technical Analysis (D1 Timeframe)
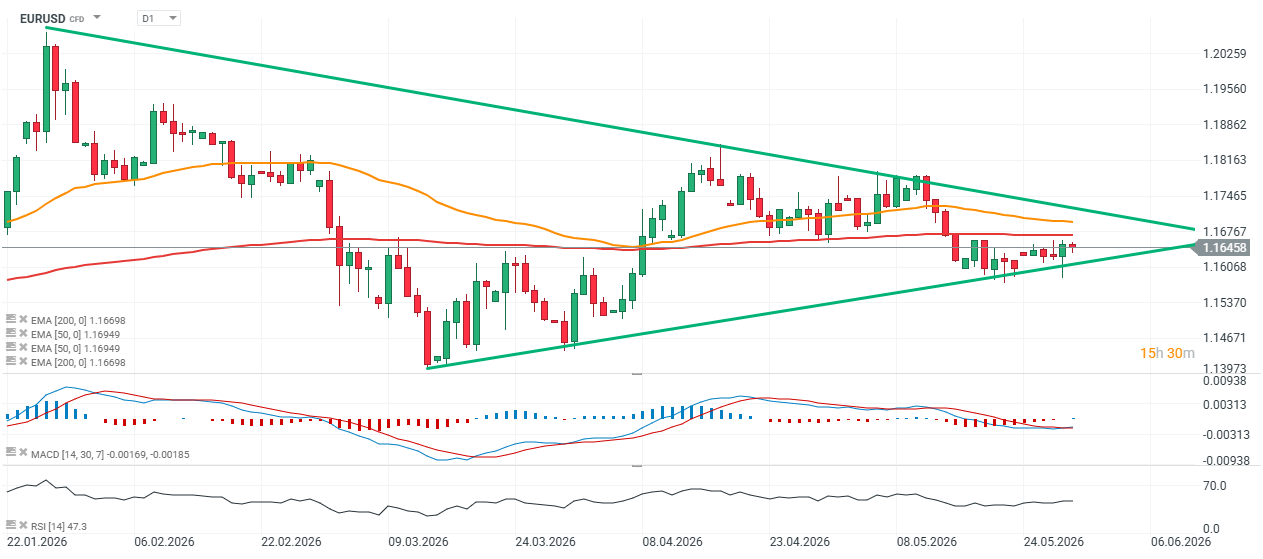
On the daily chart, EURUSD remains trapped within a medium-term symmetrical triangle, a consolidation pattern that has been developing since March. The pair is now trading very close to the apex of the formation, suggesting that a breakout and a stronger directional move may be approaching.
Price is currently oscillating around the 50-day EMA (1.1695) and the 200-day EMA (1.1670). The two moving averages are trading very close to each other, confirming the lack of a clear trend and highlighting the market's transition into a balanced, range-bound environment. EURUSD remains slightly below the 50-day EMA but above the 200-day EMA, maintaining a broadly neutral technical setup.
The upper boundary of the triangle is currently located around 1.1680–1.1700, while key support can be found near 1.1630–1.1650. The market has respected both boundaries multiple times, with April and May highs repeatedly stalling near resistance and March and May lows establishing a rising support line.
From a technical perspective, breakouts from symmetrical triangles often lead to sharp directional moves, particularly when they occur close to the apex of the pattern.
MACD and RSI
The MACD remains below the zero line, although the histogram is clearly reducing its negative readings. This suggests:
- Fading bearish momentum,
- The potential emergence of a bullish signal if the MACD line crosses above the signal line.
While this is not yet a definitive buy signal, selling pressure appears to be weakening.
Meanwhile, the RSI is hovering around 48, almost exactly at neutral territory. This leaves room for both an upside breakout and a downside move without indicating either overbought or oversold conditions.
Key Levels to Watch
Support:
- 1.1640–1.1650 (lower boundary of the triangle)
- 1.1600
- 1.1540
Resistance:
- 1.1680–1.1700 (upper boundary of the triangle)
- 1.1760
- 1.1820–1.1850
Bullish Scenario
A break above 1.1700 accompanied by a daily close above the upper boundary of the triangle would represent the first major signal of renewed bullish momentum. In such a scenario, EURUSD could initially target the 1.1760 area before potentially retesting April highs near 1.1820–1.1850.
Bearish Scenario
If the pair fails to overcome resistance and instead breaks below support around 1.1640, the risk of a move toward 1.1600 and subsequently 1.1540 would increase significantly. Such a breakout would also be supported by the MACD remaining below the zero line.
Conclusion
From a technical standpoint, EURUSD is currently at an equilibrium point. The most important feature on the chart remains the narrowing symmetrical triangle, which points to an approaching breakout. As long as the pair remains trapped between 1.1640 and 1.1700, neither bulls nor bears have a clear advantage. However, the gradual fading of bearish momentum on the MACD slightly increases the probability of an upside breakout attempt in the coming sessions.
Source: xStation5



Three markets to watch next week (23.10.2026)

BREAKING: France slows down, Germany holds on. Euro falls below 1.12

Chart of the Day: Is USDJPY running out of road? Inflation forces the BoJ to act, but the Fed could spoil the Yen’s rally



Macro Calendar: Preliminary PMI Readings and Earnings Ahead
The content of this report has been created by XTB S.A., with its registered office in Warsaw, at Prosta 67, 00-838 Warsaw, Poland, (KRS number 0000217580) and supervised by Polish Supervision Authority ( No. DDM-M-4021-57-1/2005). This material is a marketing communication within the meaning of Art. 24 (3) of Directive 2014/65/EU of the European Parliament and of the Council of 15 May 2014 on markets in financial instruments and amending Directive 2002/92/EC and Directive 2011/61/EU (MiFID II). Marketing communication is not an investment recommendation or information recommending or suggesting an investment strategy within the meaning of Regulation (EU) No 596/2014 of the European Parliament and of the Council of 16 April 2014 on market abuse (market abuse regulation) and repealing Directive 2003/6/EC of the European Parliament and of the Council and Commission Directives 2003/124/EC, 2003/125/EC and 2004/72/EC and Commission Delegated Regulation (EU) 2016/958 of 9 March 2016 supplementing Regulation (EU) No 596/2014 of the European Parliament and of the Council with regard to regulatory technical standards for the technical arrangements for objective presentation of investment recommendations or other information recommending or suggesting an investment strategy and for disclosure of particular interests or indications of conflicts of interest or any other advice, including in the area of investment advisory, within the meaning of the Trading in Financial Instruments Act of 29 July 2005 (i.e. Journal of Laws 2019, item 875, as amended). The marketing communication is prepared with the highest diligence, objectivity, presents the facts known to the author on the date of preparation and is devoid of any evaluation elements. The marketing communication is prepared without considering the client’s needs, his individual financial situation and does not present any investment strategy in any way. The marketing communication does not constitute an offer of sale, offering, subscription, invitation to purchase, advertisement or promotion of any financial instruments. XTB S.A. is not liable for any client’s actions or omissions, in particular for the acquisition or disposal of financial instruments, undertaken on the basis of the information contained in this marketing communication. In the event that the marketing communication contains any information about any results regarding the financial instruments indicated therein, these do not constitute any guarantee or forecast regarding the future results.