
Gold jumped at the beginning of this week and managed to break above the resistance zone ranging above the $1,830 level. However, volatility faded later on and the precious metal traded in a $1,835-1,845 range following the upside breakout. While it is common for gold to gain at times of market turmoil, the situation looked different recently. Gold has been moving lower during the Asian session and a strong downward impulse was triggered at the start of the European cash trading. Price dropped back below $1,835 and is now testing the aforementioned $1,830 zone as a support. Weakness on the gold market can be blamed at a pick-up in market rates. Increase in US yields is making gold less attractive as an investment and outlook may not improve soon as Fed is expected to tighten policy. Big event for gold traders will come next week on Wednesday, when the FOMC announces its next monetary policy decision at 7:00 pm GMT. No change in the level of rates is expected yet but some guidance on the case is likely to be offered.
Taking a look at GOLD from a technical point of view, we can see that a local head and shoulders pattern was painted on the H1 interval. Neckline of this pattern was broken this morning and one cannot rule out that a deeper downward move is looming. However, a lot will depend on the reaction to the $1,830 support zone.
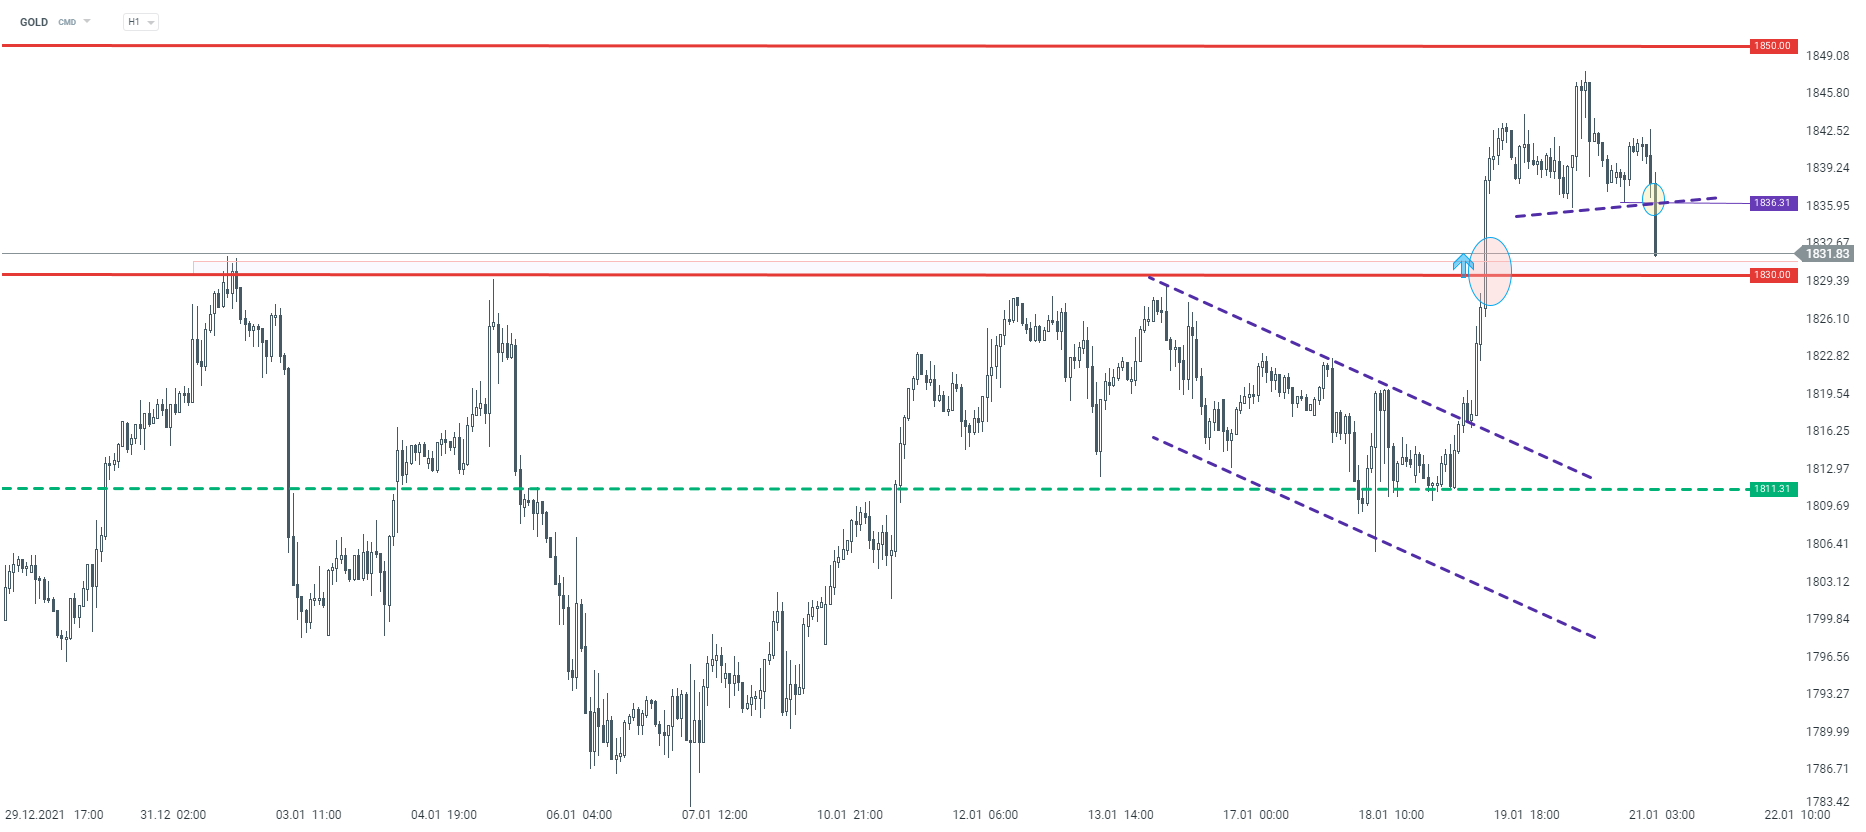 Source: xStation5

Daily Summary: Wall Street Regains Ground; Another Intervention in the Yen Market❓

Three Markets to Watch Next Week (July 31, 2026)

Market Wrap: European equities at 3-week highs! Apple dips in US premarket!

Economic Calendar: Key European CPI Readings and Oil Giants’ Earnings
The content of this report has been created by XTB S.A., with its registered office in Warsaw, at Prosta 67, 00-838 Warsaw, Poland, (KRS number 0000217580) and supervised by Polish Supervision Authority ( No. DDM-M-4021-57-1/2005). This material is a marketing communication within the meaning of Art. 24 (3) of Directive 2014/65/EU of the European Parliament and of the Council of 15 May 2014 on markets in financial instruments and amending Directive 2002/92/EC and Directive 2011/61/EU (MiFID II). Marketing communication is not an investment recommendation or information recommending or suggesting an investment strategy within the meaning of Regulation (EU) No 596/2014 of the European Parliament and of the Council of 16 April 2014 on market abuse (market abuse regulation) and repealing Directive 2003/6/EC of the European Parliament and of the Council and Commission Directives 2003/124/EC, 2003/125/EC and 2004/72/EC and Commission Delegated Regulation (EU) 2016/958 of 9 March 2016 supplementing Regulation (EU) No 596/2014 of the European Parliament and of the Council with regard to regulatory technical standards for the technical arrangements for objective presentation of investment recommendations or other information recommending or suggesting an investment strategy and for disclosure of particular interests or indications of conflicts of interest or any other advice, including in the area of investment advisory, within the meaning of the Trading in Financial Instruments Act of 29 July 2005 (i.e. Journal of Laws 2019, item 875, as amended). The marketing communication is prepared with the highest diligence, objectivity, presents the facts known to the author on the date of preparation and is devoid of any evaluation elements. The marketing communication is prepared without considering the client’s needs, his individual financial situation and does not present any investment strategy in any way. The marketing communication does not constitute an offer of sale, offering, subscription, invitation to purchase, advertisement or promotion of any financial instruments. XTB S.A. is not liable for any client’s actions or omissions, in particular for the acquisition or disposal of financial instruments, undertaken on the basis of the information contained in this marketing communication. In the event that the marketing communication contains any information about any results regarding the financial instruments indicated therein, these do not constitute any guarantee or forecast regarding the future results.