



The Nasdaq 100 is extending its correction, with futures on the index (US100) trading 0.3% lower today as mounting pressure on semiconductor stocks points to a shift in investor sentiment towards the US technology sector. During Monday's session, the index fell 1.39%, closing at 27,989 points, approximately 10.4% below its October 6 all-time high. This marks the Nasdaq 100's third technical correction in 2026, although the benchmark is still up around 11% year to date. Importantly, weakness among the largest technology companies contrasts with the relatively resilient performance of the broader market. The vast majority of S&P 500 constituents finished yesterday's session higher.
-
The strongest selling pressure is concentrated in semiconductor stocks, with the sector's benchmark index losing approximately 12% in just three sessions. On Monday, AMD fell 7.5%, Micron declined 5.8%, and Intel dropped 8.8%, while NVIDIA lost around 1.3%. Investors are becoming increasingly cautious about the future profitability of artificial intelligence investments, while weakness in US semiconductor stocks triggered another sell-off in South Korean memory chip manufacturers SK Hynix and Samsung.
-
Concerns about financing enormous AI infrastructure investments are intensifying, with Oracle shares falling around 9% yesterday following reports of plans to raise $20 billion through debt and equity issuance. Investors are increasingly scrutinising whether multibillion-dollar spending on data centres and computing infrastructure will translate into sufficiently strong cash flows rather than merely rapid revenue growth.
-
The largest technology companies also came under pressure, including Microsoft (-2.8%) and Apple (-1.8%). The Nasdaq's high market-capitalisation concentration means that weakness in just a handful of its largest constituents can weigh heavily on the entire index, even when most US stocks perform relatively well.
-
Even earnings that exceed analysts' forecasts are no longer sufficient to sustain share price gains. Apple and Palantir both beat market expectations, yet the market reaction remained cautious. This is characteristic of companies trading at elevated valuation multiples, where investors have already priced in years of strong growth, leaving limited room for disappointment.
-
Today's earnings reports from AMD and Arista Networks will provide an important test of the AI sector's underlying strength. Investors will focus on revenue guidance, profit margins and the pace of orders for computing and networking infrastructure. Additional sources of volatility include the US congressional elections, the JOLTS job openings report and renewed increases in oil prices amid tensions surrounding Iran.
The current correction does not necessarily imply a lasting deterioration in technology sector fundamentals, but it clearly illustrates a shift in how investors assess these companies. The market is becoming less focused on the potential of artificial intelligence alone and increasingly concerned with the costs of deploying it, returns on invested capital and the ability to generate cash. If upcoming earnings reports confirm strong revenue growth but also reveal further pressure on cash flows, solid financial results may not be enough to bring the correction to an end. On the other hand, the substantial cooling of technology sector valuations and potential positive catalysts, such as a decline in oil prices, should not be overlooked.
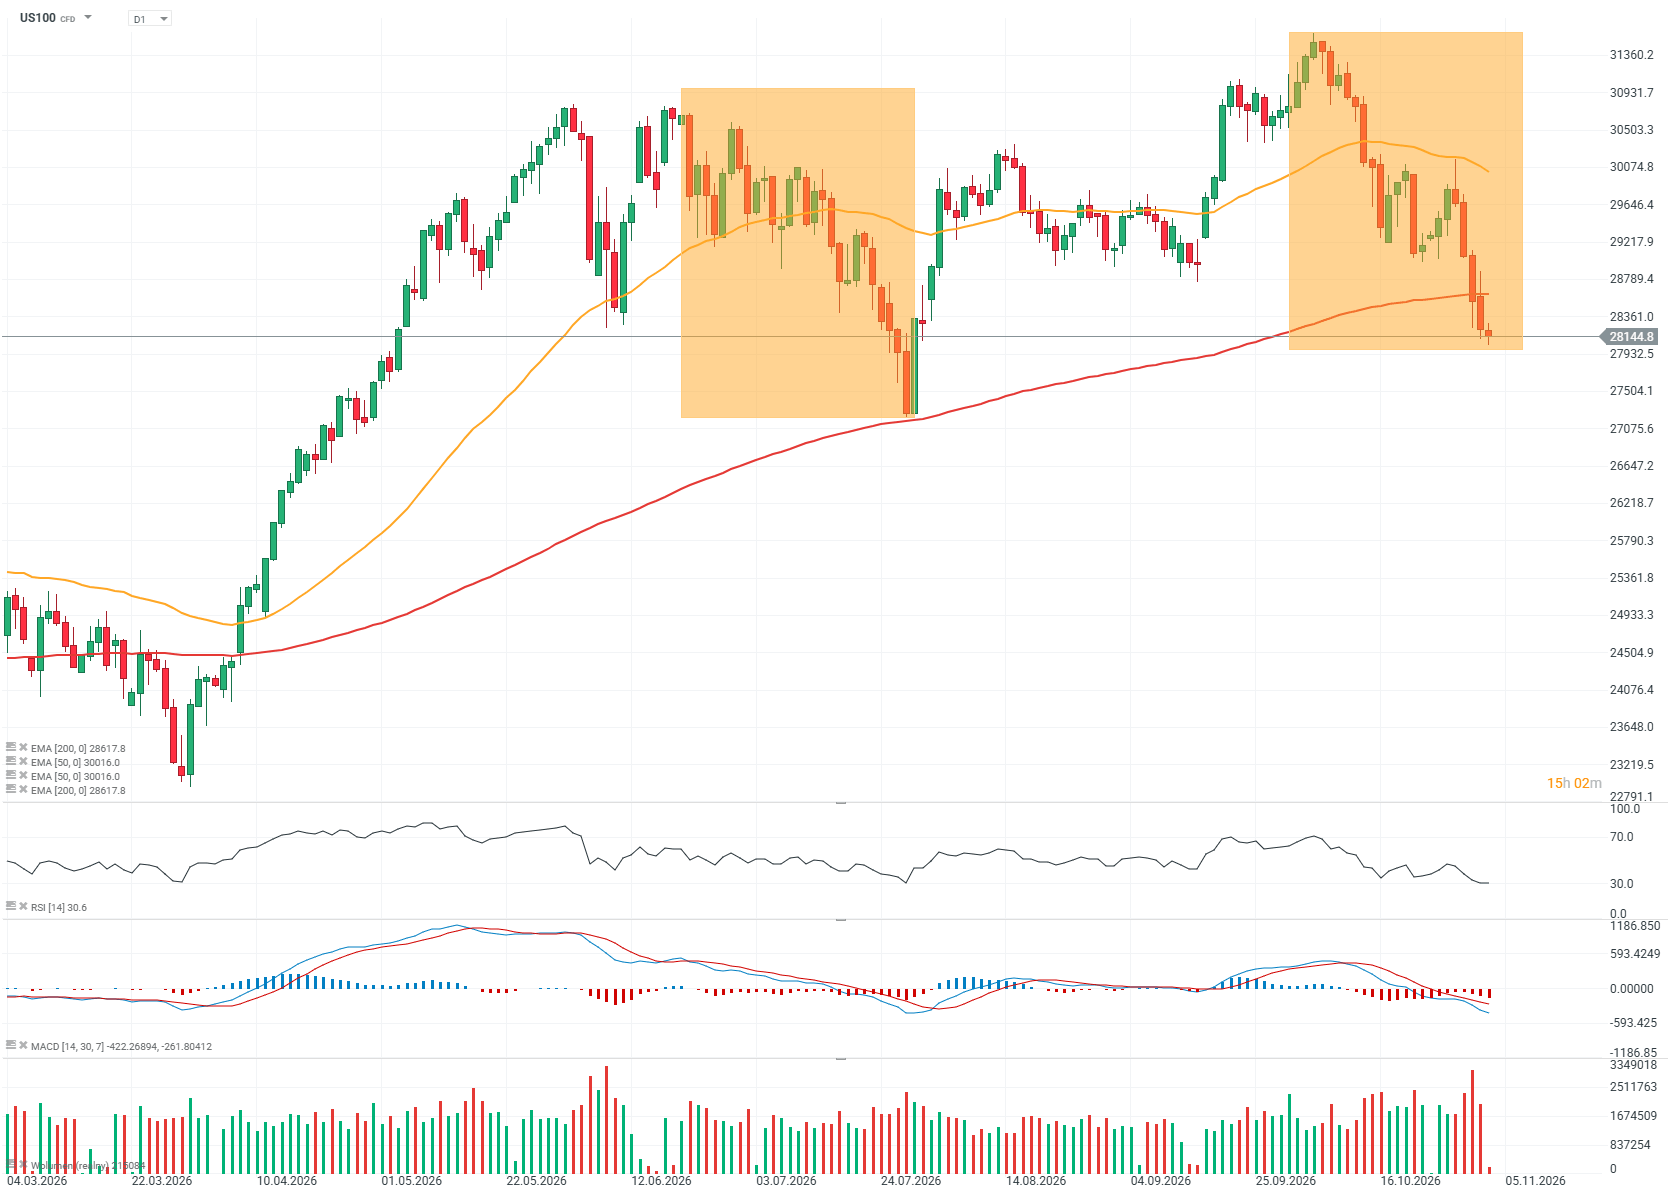
US100 chart (D1 timeframe)
Nasdaq 100 futures have retreated to around 28,000 points from record levels near 31,400 and are trading below the 200-day exponential moving average (EMA200, red line) for the first time since March 2026. A swift recovery towards 28,500 points appears to be the first objective for buyers, while the next important support level stands at 27,000 points, corresponding to the lows recorded around the turn of July and August. The magnitude of the current downward move is very similar to the correction seen during the summer, which was followed by a strong rebound. A convincing bullish candlestick, potentially testing the 28,800-point area, would provide an important initial signal of a possible recovery in upward momentum.
 Source: xStation5


Economic Calendar: US Midterms, JOLTS and Factory Orders Take Center Stage (03.11.2026)


Morning wrap: Stock Indices Fall Again 🚩 Oil Tries To Rebound Following US Strike on Iran’s Qeshm Island (03.11.2026)



Daily Summary: A Rollercoaster Ride in the Commodities Market🚨Oil Drops 7%; Gold Rallies Over 2%💥


🚨Oil and gas in Europe in a panic sell-off
The content of this report has been created by XTB S.A., with its registered office in Warsaw, at Prosta 67, 00-838 Warsaw, Poland, (KRS number 0000217580) and supervised by Polish Supervision Authority ( No. DDM-M-4021-57-1/2005). This material is a marketing communication within the meaning of Art. 24 (3) of Directive 2014/65/EU of the European Parliament and of the Council of 15 May 2014 on markets in financial instruments and amending Directive 2002/92/EC and Directive 2011/61/EU (MiFID II). Marketing communication is not an investment recommendation or information recommending or suggesting an investment strategy within the meaning of Regulation (EU) No 596/2014 of the European Parliament and of the Council of 16 April 2014 on market abuse (market abuse regulation) and repealing Directive 2003/6/EC of the European Parliament and of the Council and Commission Directives 2003/124/EC, 2003/125/EC and 2004/72/EC and Commission Delegated Regulation (EU) 2016/958 of 9 March 2016 supplementing Regulation (EU) No 596/2014 of the European Parliament and of the Council with regard to regulatory technical standards for the technical arrangements for objective presentation of investment recommendations or other information recommending or suggesting an investment strategy and for disclosure of particular interests or indications of conflicts of interest or any other advice, including in the area of investment advisory, within the meaning of the Trading in Financial Instruments Act of 29 July 2005 (i.e. Journal of Laws 2019, item 875, as amended). The marketing communication is prepared with the highest diligence, objectivity, presents the facts known to the author on the date of preparation and is devoid of any evaluation elements. The marketing communication is prepared without considering the client’s needs, his individual financial situation and does not present any investment strategy in any way. The marketing communication does not constitute an offer of sale, offering, subscription, invitation to purchase, advertisement or promotion of any financial instruments. XTB S.A. is not liable for any client’s actions or omissions, in particular for the acquisition or disposal of financial instruments, undertaken on the basis of the information contained in this marketing communication. In the event that the marketing communication contains any information about any results regarding the financial instruments indicated therein, these do not constitute any guarantee or forecast regarding the future results.