



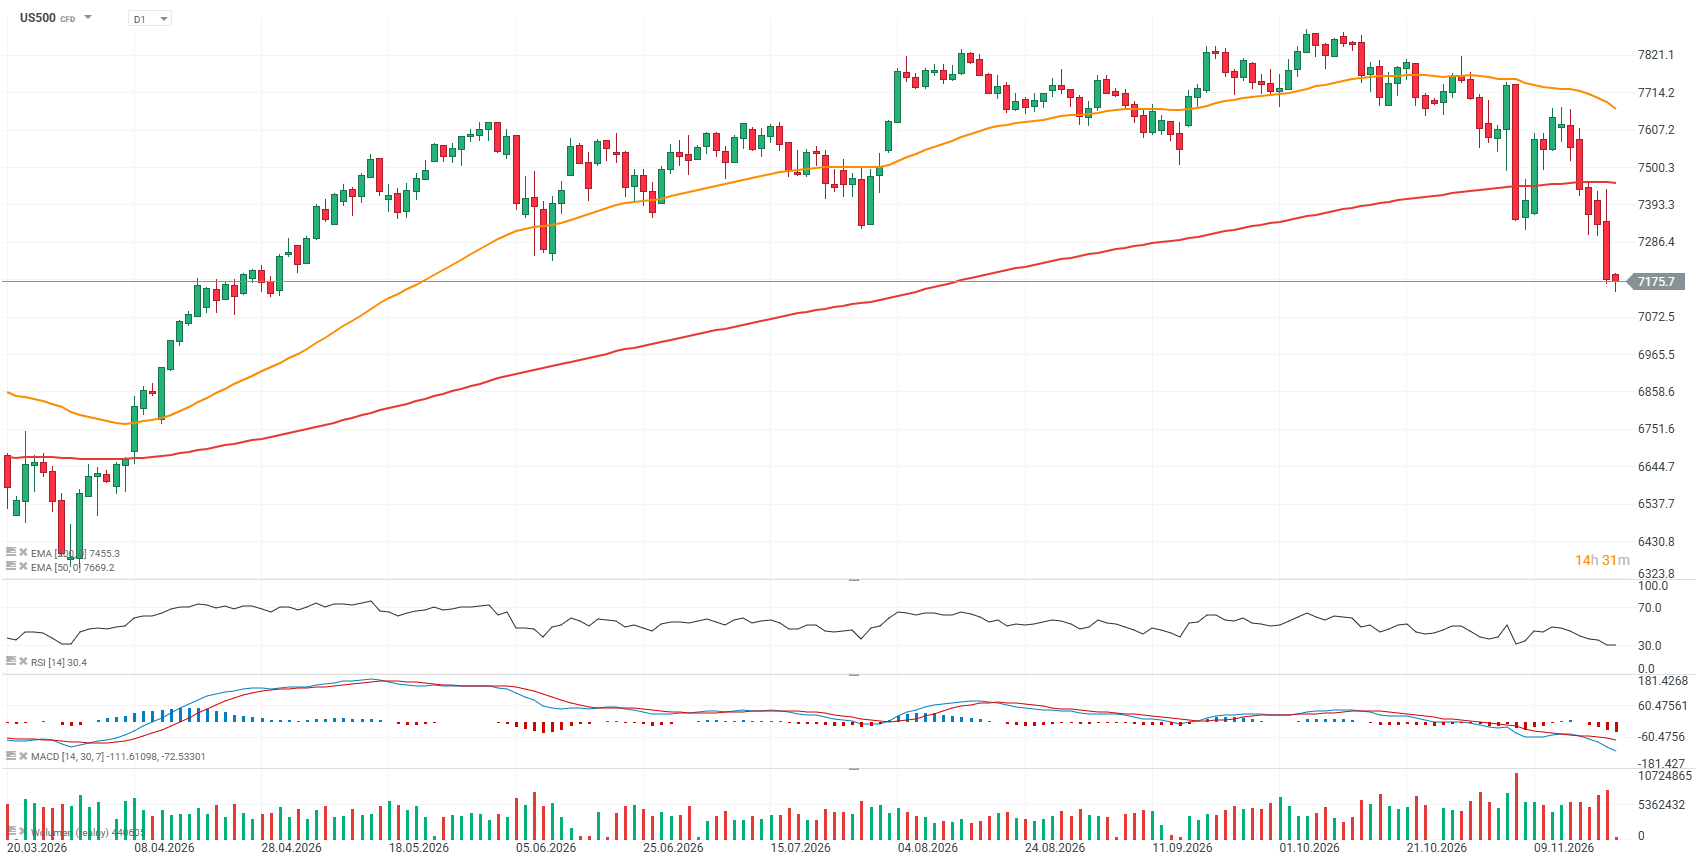
The S&P 500 futures contract (US500) is extending its selloff today, having recently fallen below the key support level of 7,300 points, raising the risk of a deeper downtrend. The index is now down approximately 10% from its peak, meeting the conventional definition of a market correction. This marks the fifth correction of this magnitude since the index emerged from the relatively mild and short-lived bear market of 2022.
From a fundamental perspective, S&P 500 earnings for Q3 2026 remain exceptionally strong, with the reporting season nearing completion. So far, 91% of companies in the index have reported their results, with 84% delivering positive earnings per share (EPS) surprises and 74% reporting revenue above analysts' expectations. Such a high proportion of positive earnings surprises points to the resilience of US corporate fundamentals despite elevated macroeconomic uncertainty.
-
S&P 500 earnings growth has reached 31.9% year over year, marking the third consecutive quarter of growth exceeding 25%. This is the blended earnings growth rate, which combines actual results from companies that have already reported with consensus estimates for those yet to release their earnings. The strong growth rate indicates that US corporate profitability remains robust.
-
The earnings season has brought a notable improvement in analysts' expectations, with EPS growth initially projected at 29.1% year over year on September 30. The current estimate stands at 31.9%, representing an upward revision of 2.8 percentage points. Importantly, 10 of the 11 S&P 500 sectors are now reporting or expected to report stronger earnings growth than anticipated at the end of September, supported by positive earnings surprises and upward estimate revisions.
-
Corporate earnings guidance for Q4 2026 remains relatively optimistic. So far, 45 S&P 500 companies have issued positive EPS guidance, compared with 33 companies providing negative guidance. The prevalence of positive outlooks suggests that corporate management teams continue to expect solid financial performance, although prospects vary across sectors.
-
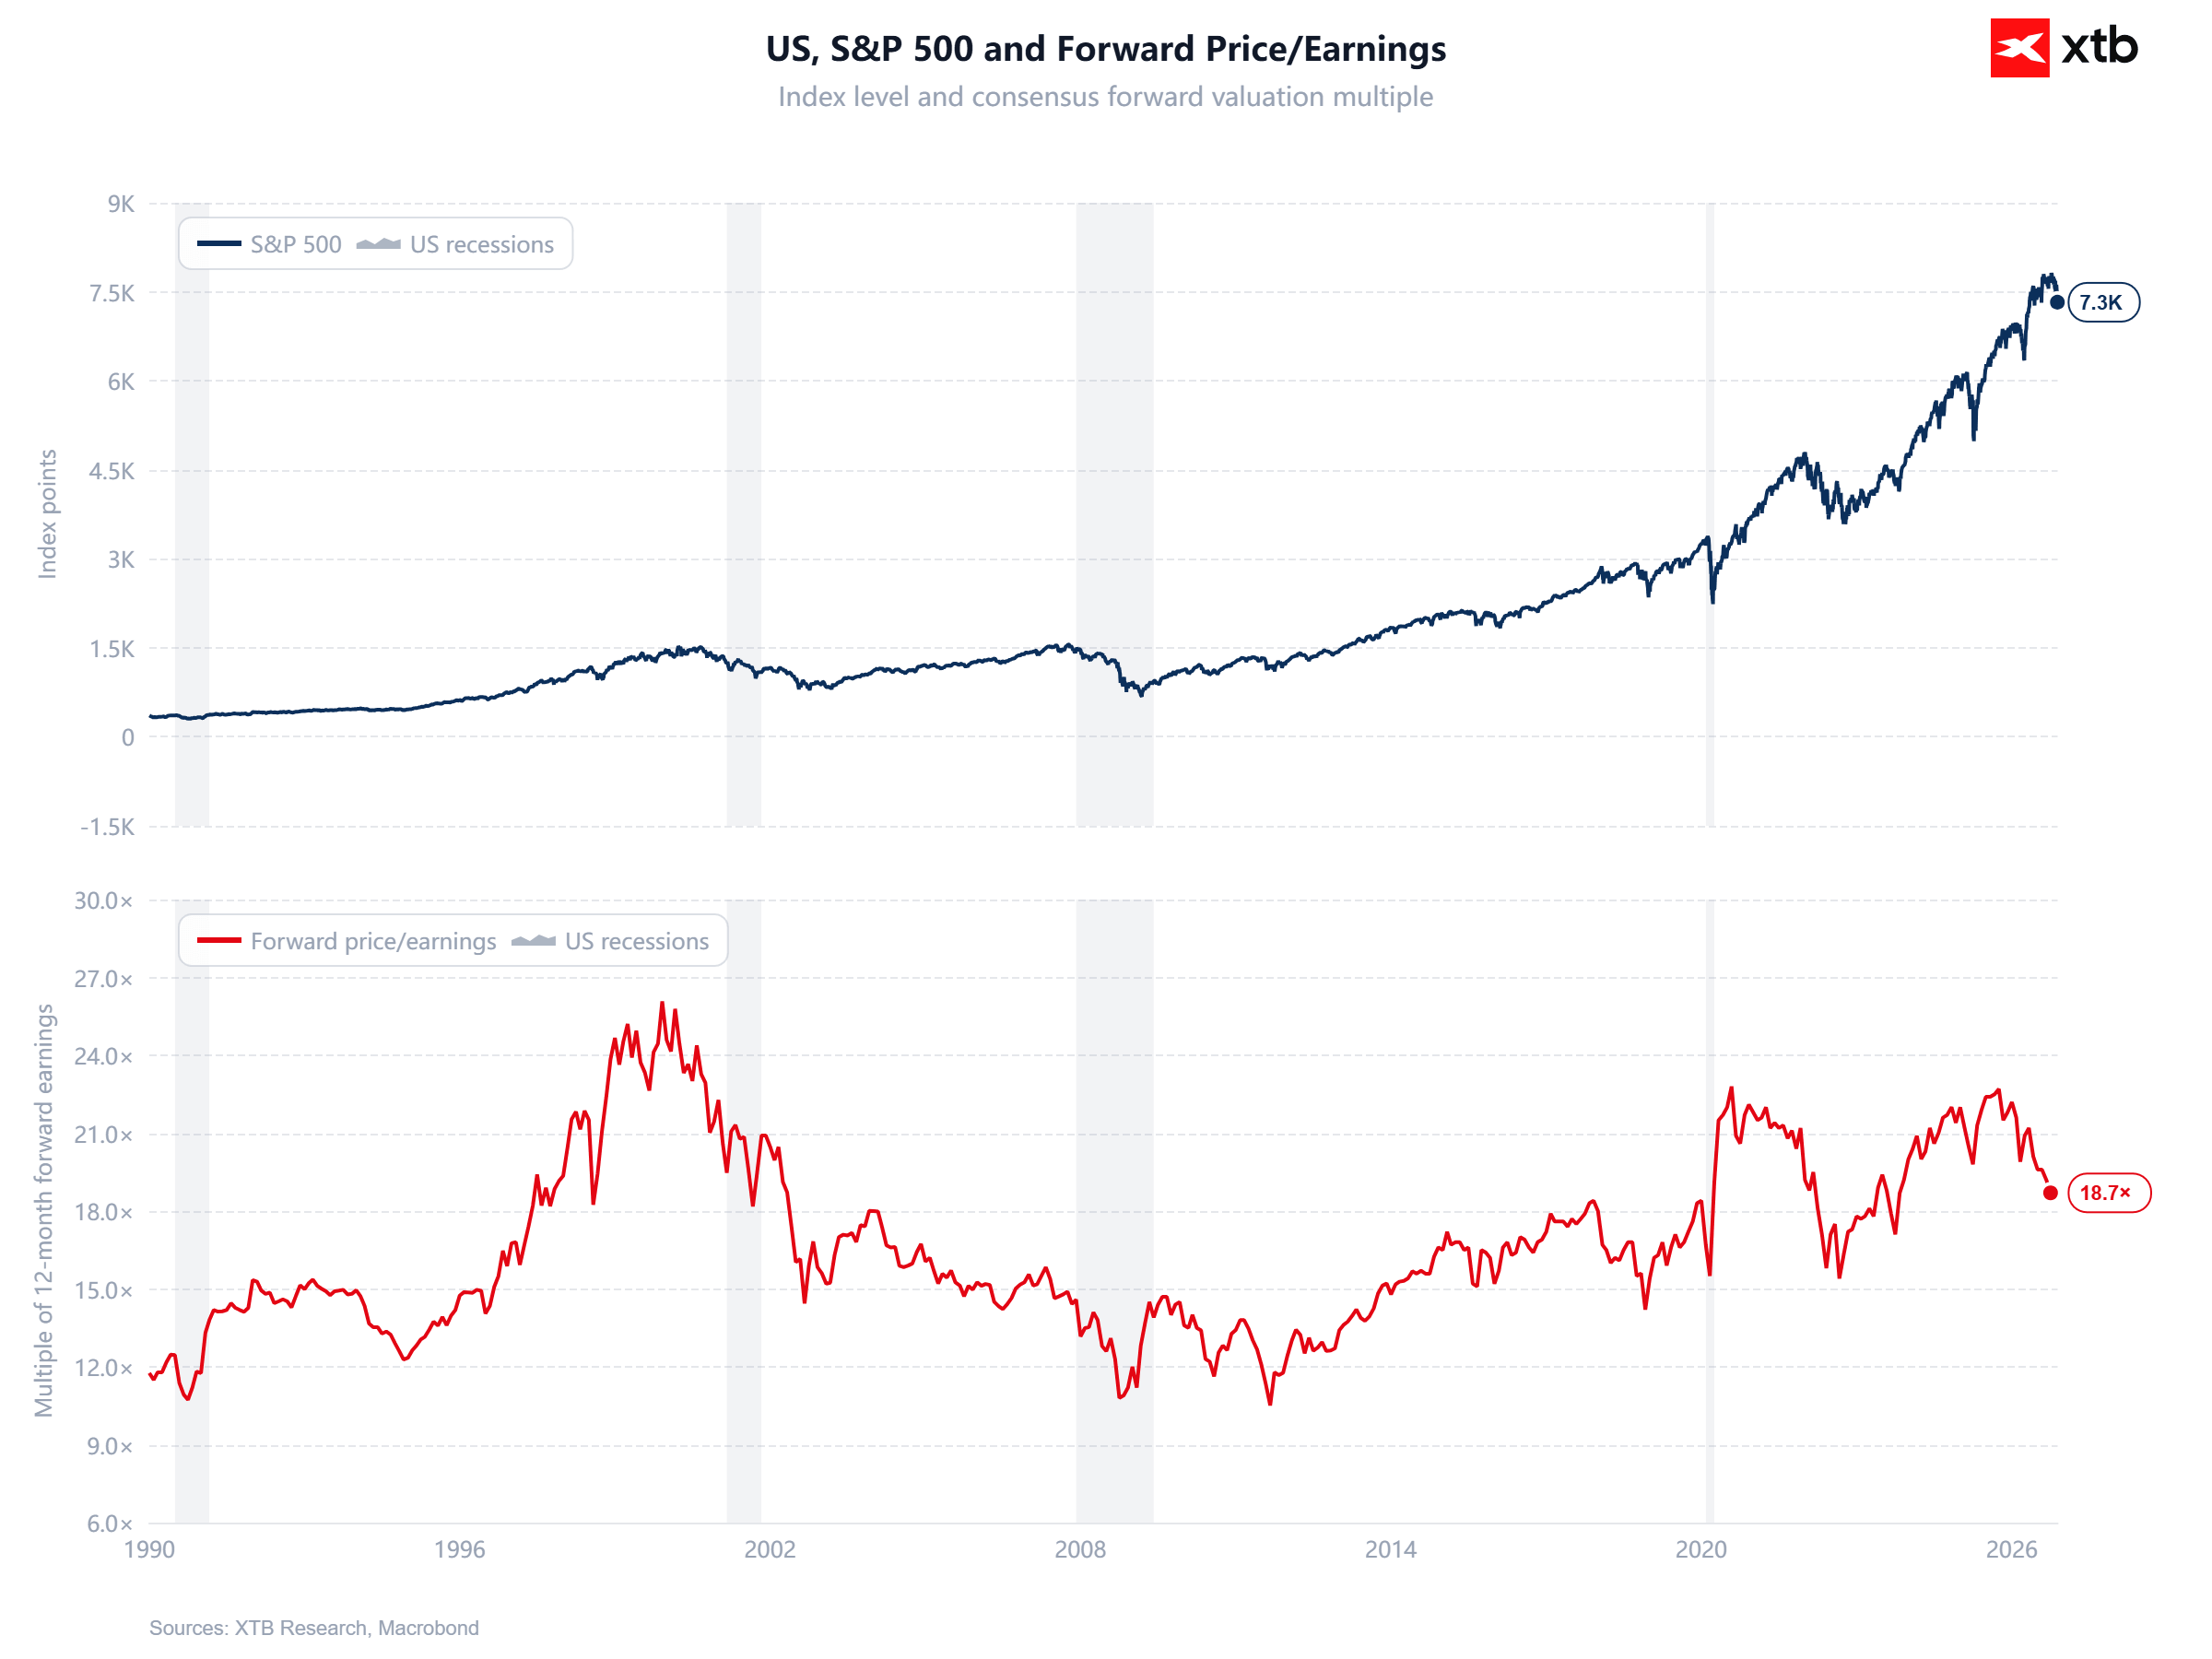
S&P 500 valuations have become more moderate relative to historical averages, despite exceptionally strong earnings growth. The index's forward 12-month P/E ratio currently stands at 18.7, compared with its five-year average of 19.8 and ten-year average of 19.1. This means the index is trading at a discount to both historical averages, potentially reducing some valuation-related risks, although further declines remain possible if the economic outlook deteriorates or bond yields rise.
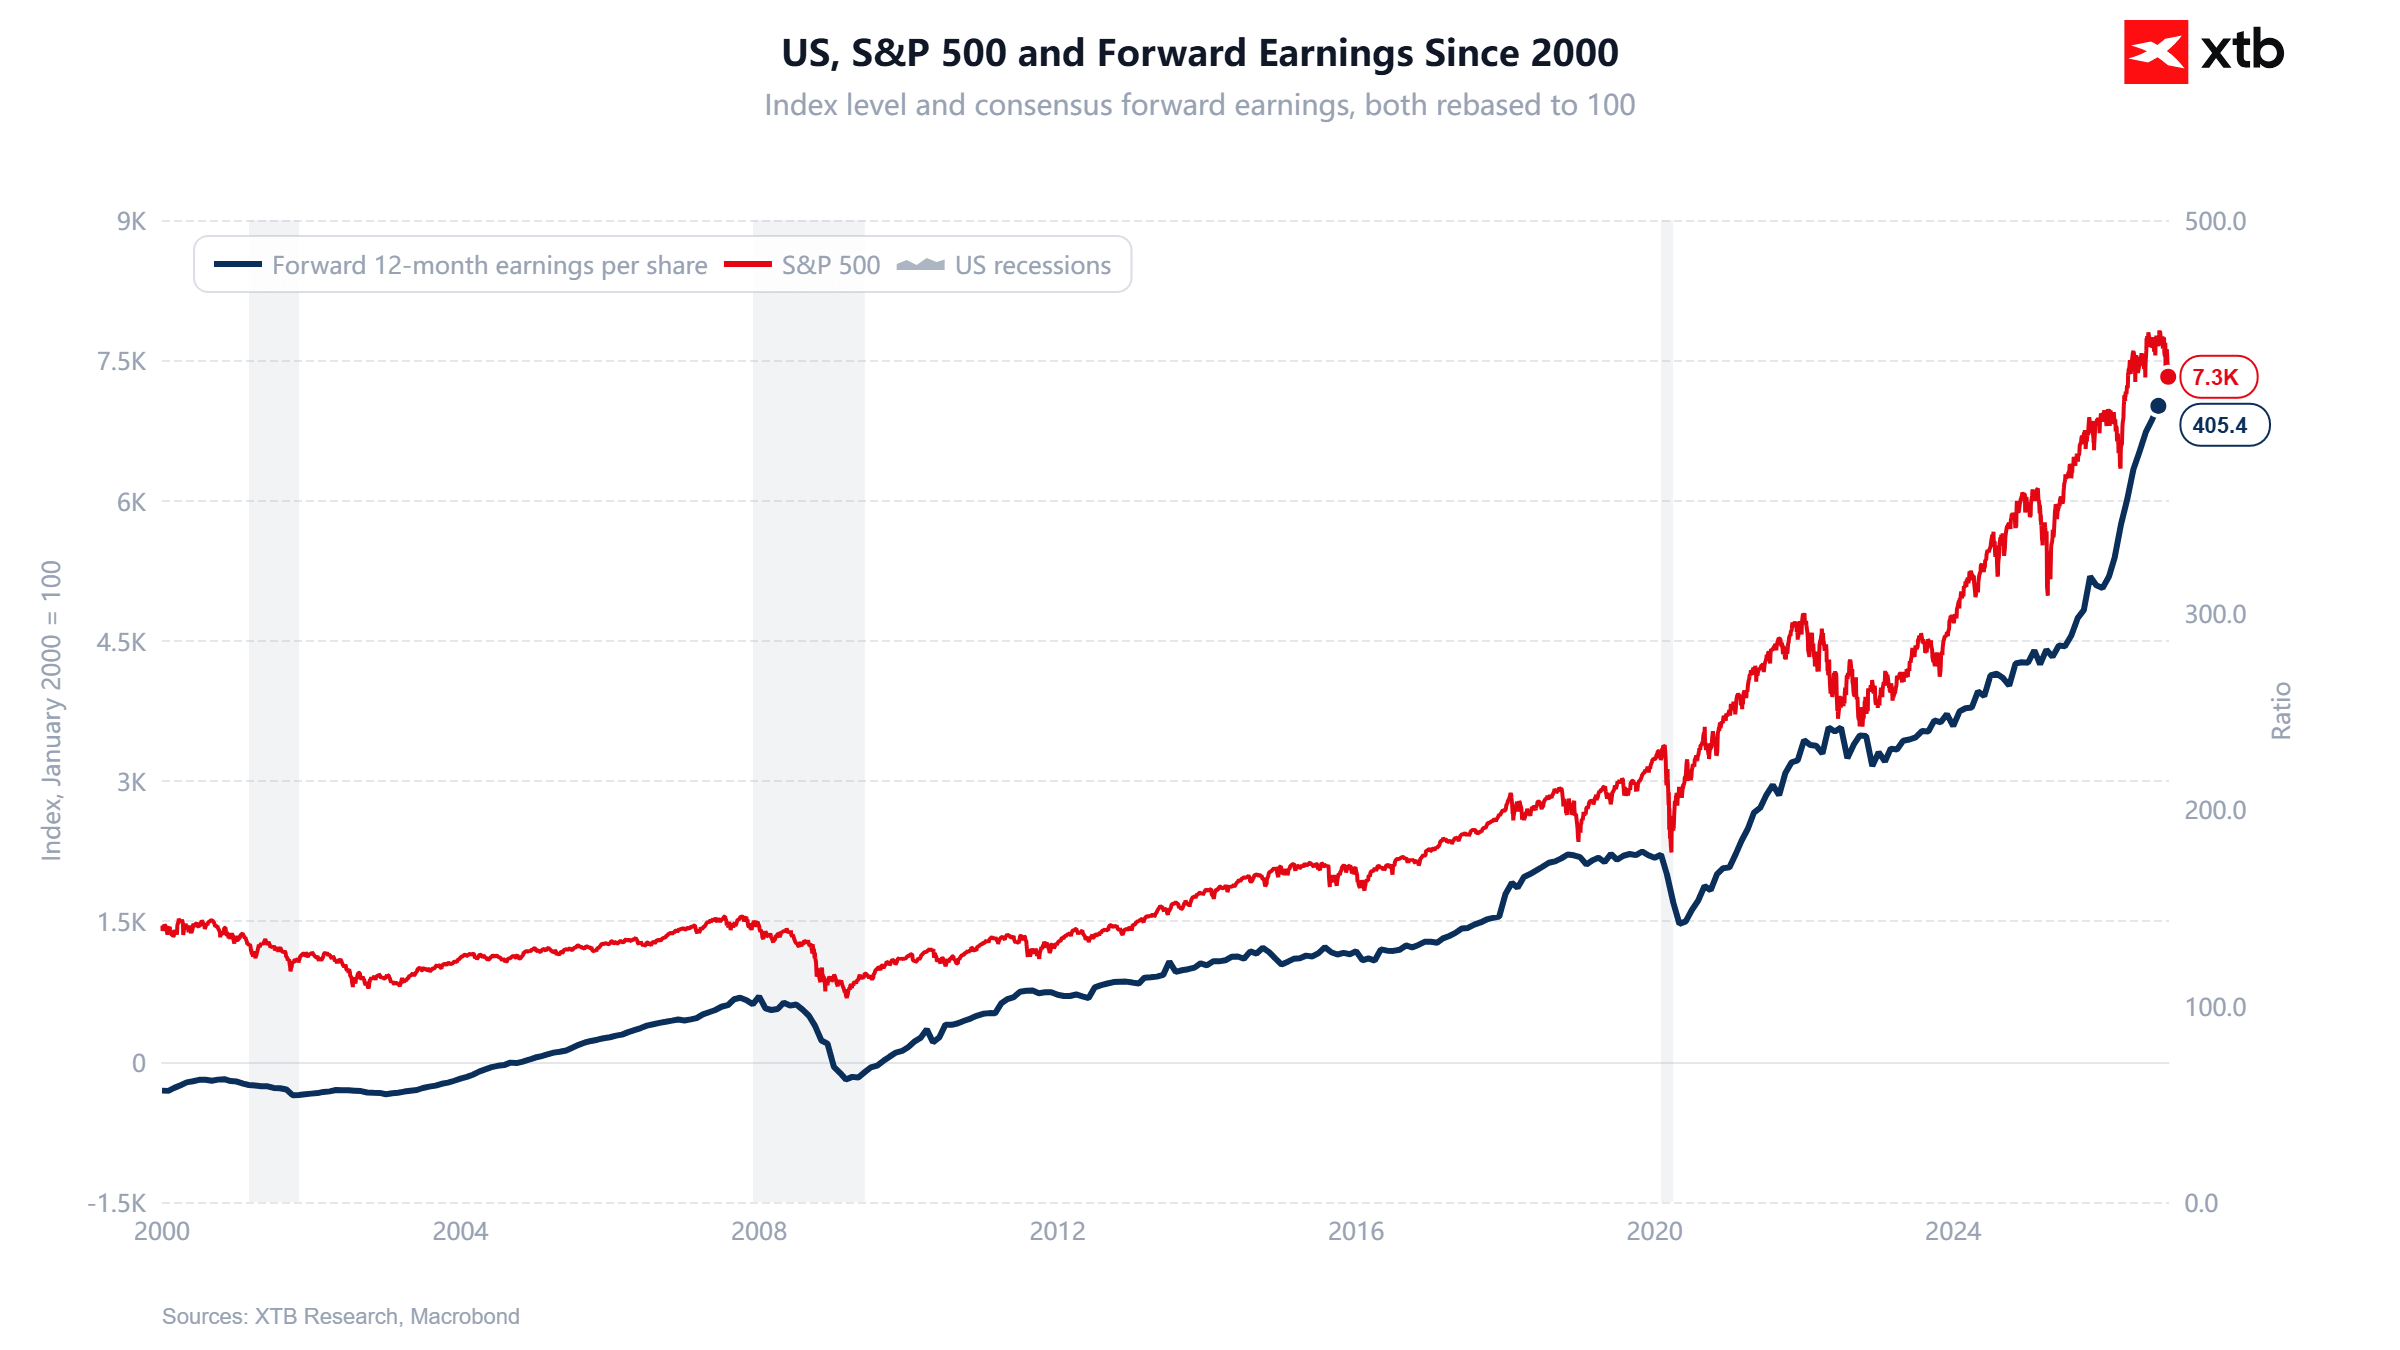 The chart illustrates the performance of the S&P 500 alongside consensus forward earnings per share (EPS) estimates for US companies since 2000. Over the long term, there is a clear relationship between corporate earnings growth and rising index levels. During the 2008 financial crisis and the 2020 pandemic, both the index and earnings expectations declined significantly. Currently, forward EPS has reached a record high of approximately $405, while the S&P 500 is trading near 7,300 points. Despite the recent market correction, earnings expectations continue to rise, suggesting that the current selloff is primarily driven by valuation compression rather than deteriorating corporate earnings expectations. Source: XTB Research, Macrobond
Wall Street is punishing earnings misses less severely, but the Magnificent 7 are an exception
The US stock market is reacting unusually mildly to negative earnings surprises among S&P 500 companies, even though the magnitude of positive earnings surprises remains relatively modest. According to FactSet, 84% of companies have exceeded EPS expectations for Q3 2026, but the aggregate earnings surprise stands at just 3.1%, compared with the five-year average of 7.5%. If this figure holds, it would mark the weakest earnings surprise since Q4 2022.
Companies that exceeded analysts' earnings expectations recorded an average share price increase of 1.1% over the period spanning two days before their earnings release through two days afterward, compared with the historical average of 0.9%. Even more notable is the market's reaction to disappointing results: companies reporting negative earnings surprises declined by just 1.1% on average, compared with the five-year average decline of 3.1%. This may reflect improving expectations for Q4. Analysts have raised the index's bottom-up EPS estimate for the quarter by 1.1% to $94.49, while 58% of companies issuing earnings guidance have provided positive outlooks, compared with a historical average of approximately 40%.
The Magnificent 7 stand out as a clear exception, with investors holding these technology giants to considerably higher standards. Apple, Microsoft and Tesla, despite exceeding EPS forecasts, recorded an average share price decline of 0.2% over the same period. Meanwhile, Alphabet, Amazon and Meta, which disappointed on earnings, experienced an average decline of 7.8%. This suggests that investors are increasingly differentiating between the largest beneficiaries of the AI boom and the broader S&P 500 market.
 Source: XTB
The chart shows changes in the S&P 500 alongside its valuation, measured by the forward P/E ratio, since 1990. The ratio currently stands at approximately 18.7, down from levels above 22 earlier in 2026. Despite the S&P 500's long-term gains, its current valuation remains considerably lower than during the dot-com bubble around the turn of the millennium, when the forward P/E ratio exceeded 25. At the same time, the index is still trading at a higher valuation than during much of the 2003–2019 period, when the ratio generally fluctuated between 12 and 18. The recent Wall Street correction has therefore significantly reduced the premium investors are willing to pay for future corporate earnings, although this does not automatically mean that US equities have become cheap.
 Source: XTB Research


Morning Wrap: Stock Indices and Metals Extend Their Declines 📉 (20.11.2026)


Market Wrap: Anthropic Lifts Sentiment, but a Hawkish Fed Keeps the Dollar High

🔼 US100 surges 2%

Wall Street rebounds amid awaited Anthropic debut 📈 What's next for US500?
The content of this report has been created by XTB S.A., with its registered office in Warsaw, at Prosta 67, 00-838 Warsaw, Poland, (KRS number 0000217580) and supervised by Polish Supervision Authority ( No. DDM-M-4021-57-1/2005). This material is a marketing communication within the meaning of Art. 24 (3) of Directive 2014/65/EU of the European Parliament and of the Council of 15 May 2014 on markets in financial instruments and amending Directive 2002/92/EC and Directive 2011/61/EU (MiFID II). Marketing communication is not an investment recommendation or information recommending or suggesting an investment strategy within the meaning of Regulation (EU) No 596/2014 of the European Parliament and of the Council of 16 April 2014 on market abuse (market abuse regulation) and repealing Directive 2003/6/EC of the European Parliament and of the Council and Commission Directives 2003/124/EC, 2003/125/EC and 2004/72/EC and Commission Delegated Regulation (EU) 2016/958 of 9 March 2016 supplementing Regulation (EU) No 596/2014 of the European Parliament and of the Council with regard to regulatory technical standards for the technical arrangements for objective presentation of investment recommendations or other information recommending or suggesting an investment strategy and for disclosure of particular interests or indications of conflicts of interest or any other advice, including in the area of investment advisory, within the meaning of the Trading in Financial Instruments Act of 29 July 2005 (i.e. Journal of Laws 2019, item 875, as amended). The marketing communication is prepared with the highest diligence, objectivity, presents the facts known to the author on the date of preparation and is devoid of any evaluation elements. The marketing communication is prepared without considering the client’s needs, his individual financial situation and does not present any investment strategy in any way. The marketing communication does not constitute an offer of sale, offering, subscription, invitation to purchase, advertisement or promotion of any financial instruments. XTB S.A. is not liable for any client’s actions or omissions, in particular for the acquisition or disposal of financial instruments, undertaken on the basis of the information contained in this marketing communication. In the event that the marketing communication contains any information about any results regarding the financial instruments indicated therein, these do not constitute any guarantee or forecast regarding the future results.