



The Nasdaq 100 has been recording a dynamic recovery since the beginning of August.
🌍 Crude Oil Prices
Tuesday's 3.2% rally was one of the strongest this year. The index was supported by lower crude oil prices, following statements from Scott Bessent. The Treasury Secretary said on CNBC that there is a chance that as early as today or tomorrow, we will be able to reach an agreement on opening the strait and take steps towards further normalisation of the situation in this conflict.
This, of course, did not materialise.
Currently, oil prices are rising again, weighing on the key US technology index.
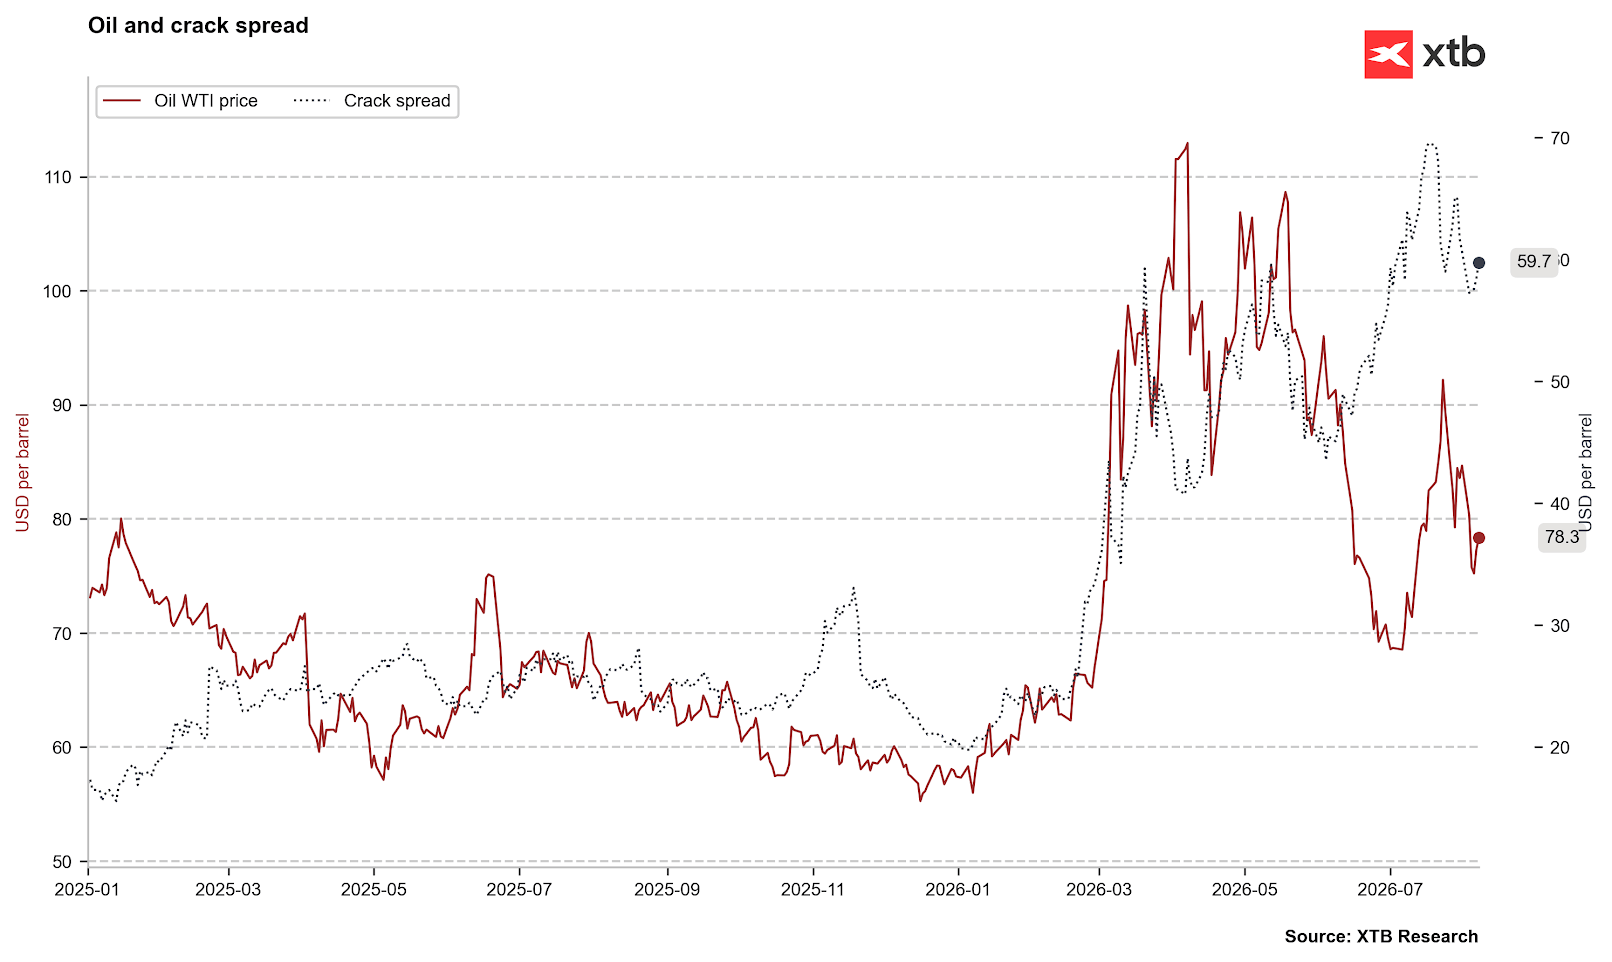
- The price for a barrel of WTI crude oil is nearly 78 dollars, representing an increase of approximately 4.5% from Wednesday's lows.
- The so-called crack spread, the difference between the price of crude oil and the prices of petroleum products derived from it (such as petrol or diesel), also remains at very high levels.
Figure 1: Price and Crack Spread for WTI Crude Oil (2025 - 2026)
 Source: XTB Research, 07.08.2026
The increases are, of course, driven by headlines from the Middle East.
Iran and Oman are nearing an agreement to clear traffic in the Strait of Hormuz. The deal is currently reportedly awaiting approval from the Iranian parliament. However, there is little indication that it has any real chance of being accepted by the US.
Authorities in Tehran are reportedly seeking to:
- introduce a total ban on passage for American and Israeli vessels,
- implement a new system of fees covering insurance and environmental costs, among others,
- demand special compensation payments from hostile states in exchange for restoring navigation rights.
📈 Earnings Season
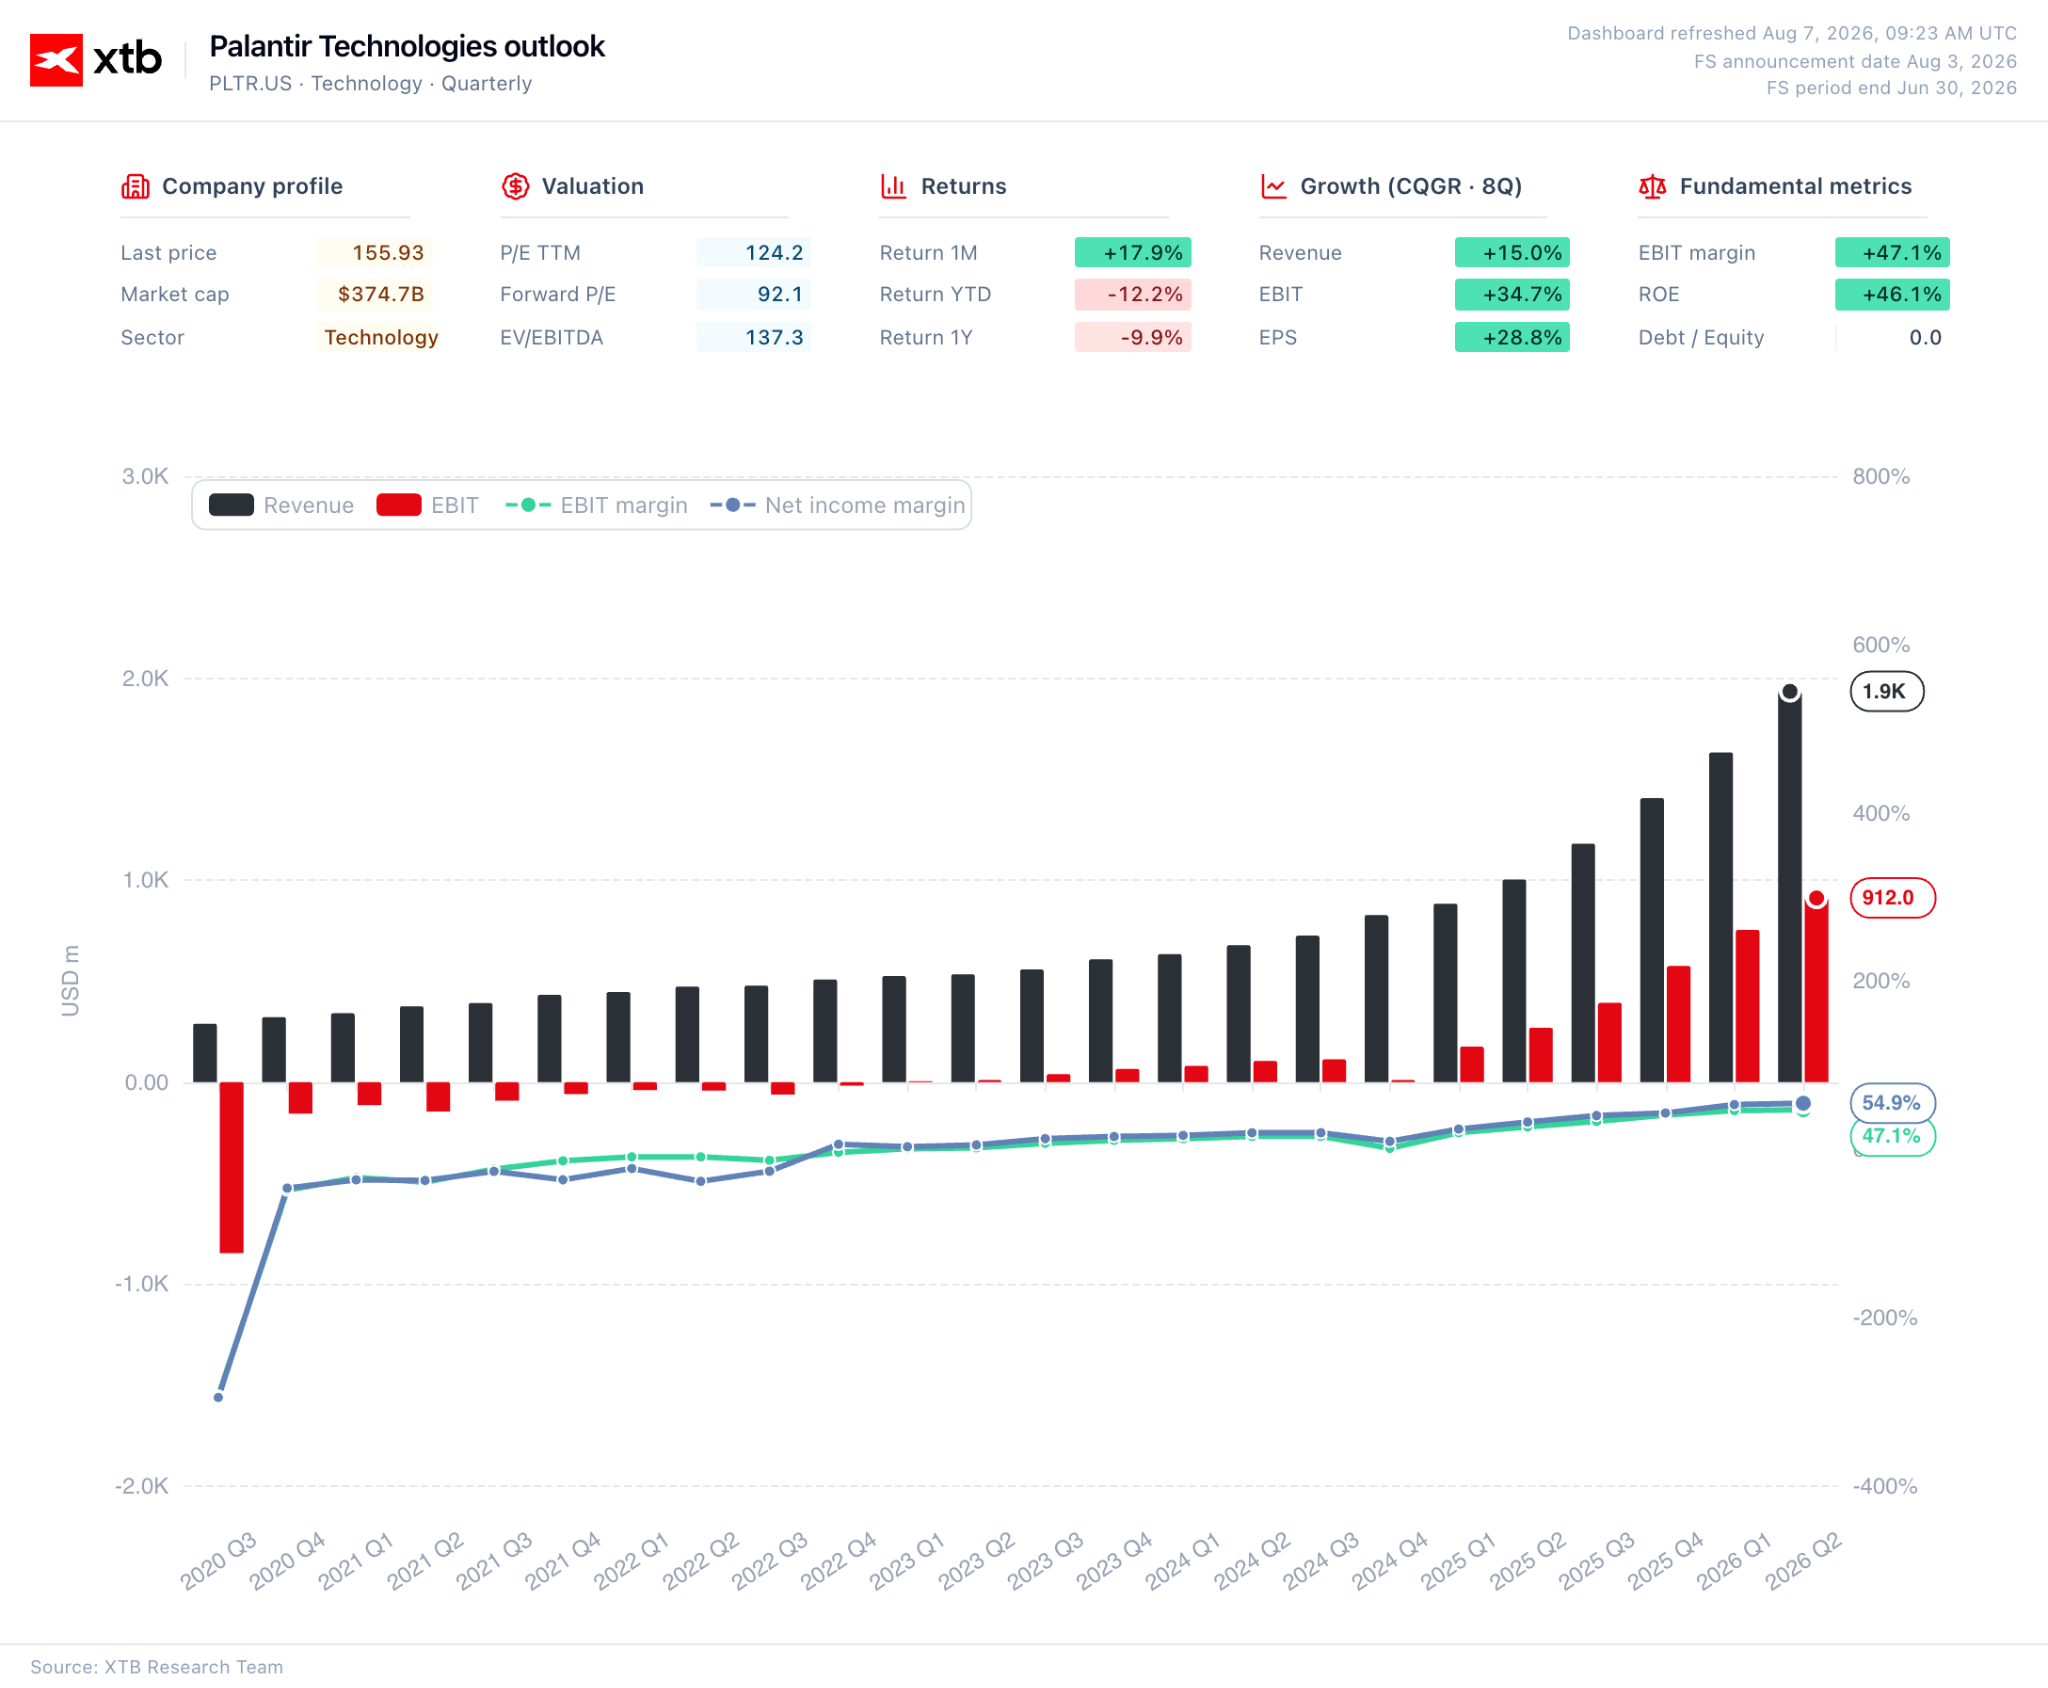
The Nasdaq also benefited in the first half of the week from results published by giants. Following the release of the Q2 report, Palantir shares rose by approximately 30%, as its products are now not just a narrow niche for government contracts but a powerful business tool for the private sector.
- Revenue growth reached 1.94 billion dollars (+94% y/y). For Q3, the company expects a result in the region of 2.16 billion dollars.
- EPS reached 0.41 dollars (+256% y/y).
Figure 2: Dashboard for Palantir (07.08.2026)
 Source: XTB Research, 07.08.2026
The improvement in sentiment towards the semiconductor sector was also beneficial, with shares bouncing slightly from local lows. Companies received some support from hyperscalers, whose quarterly reports showed unabated capital expenditure. In the case of Alphabet, CAPEX is expected to reach 200 billion dollars in 2026.
The scale of the July correction was so significant, however, that the SOX index, which comprises the 30 largest US companies involved in the design, manufacture, distribution, and sale of semiconductors, is currently approximately 17% below its peak.
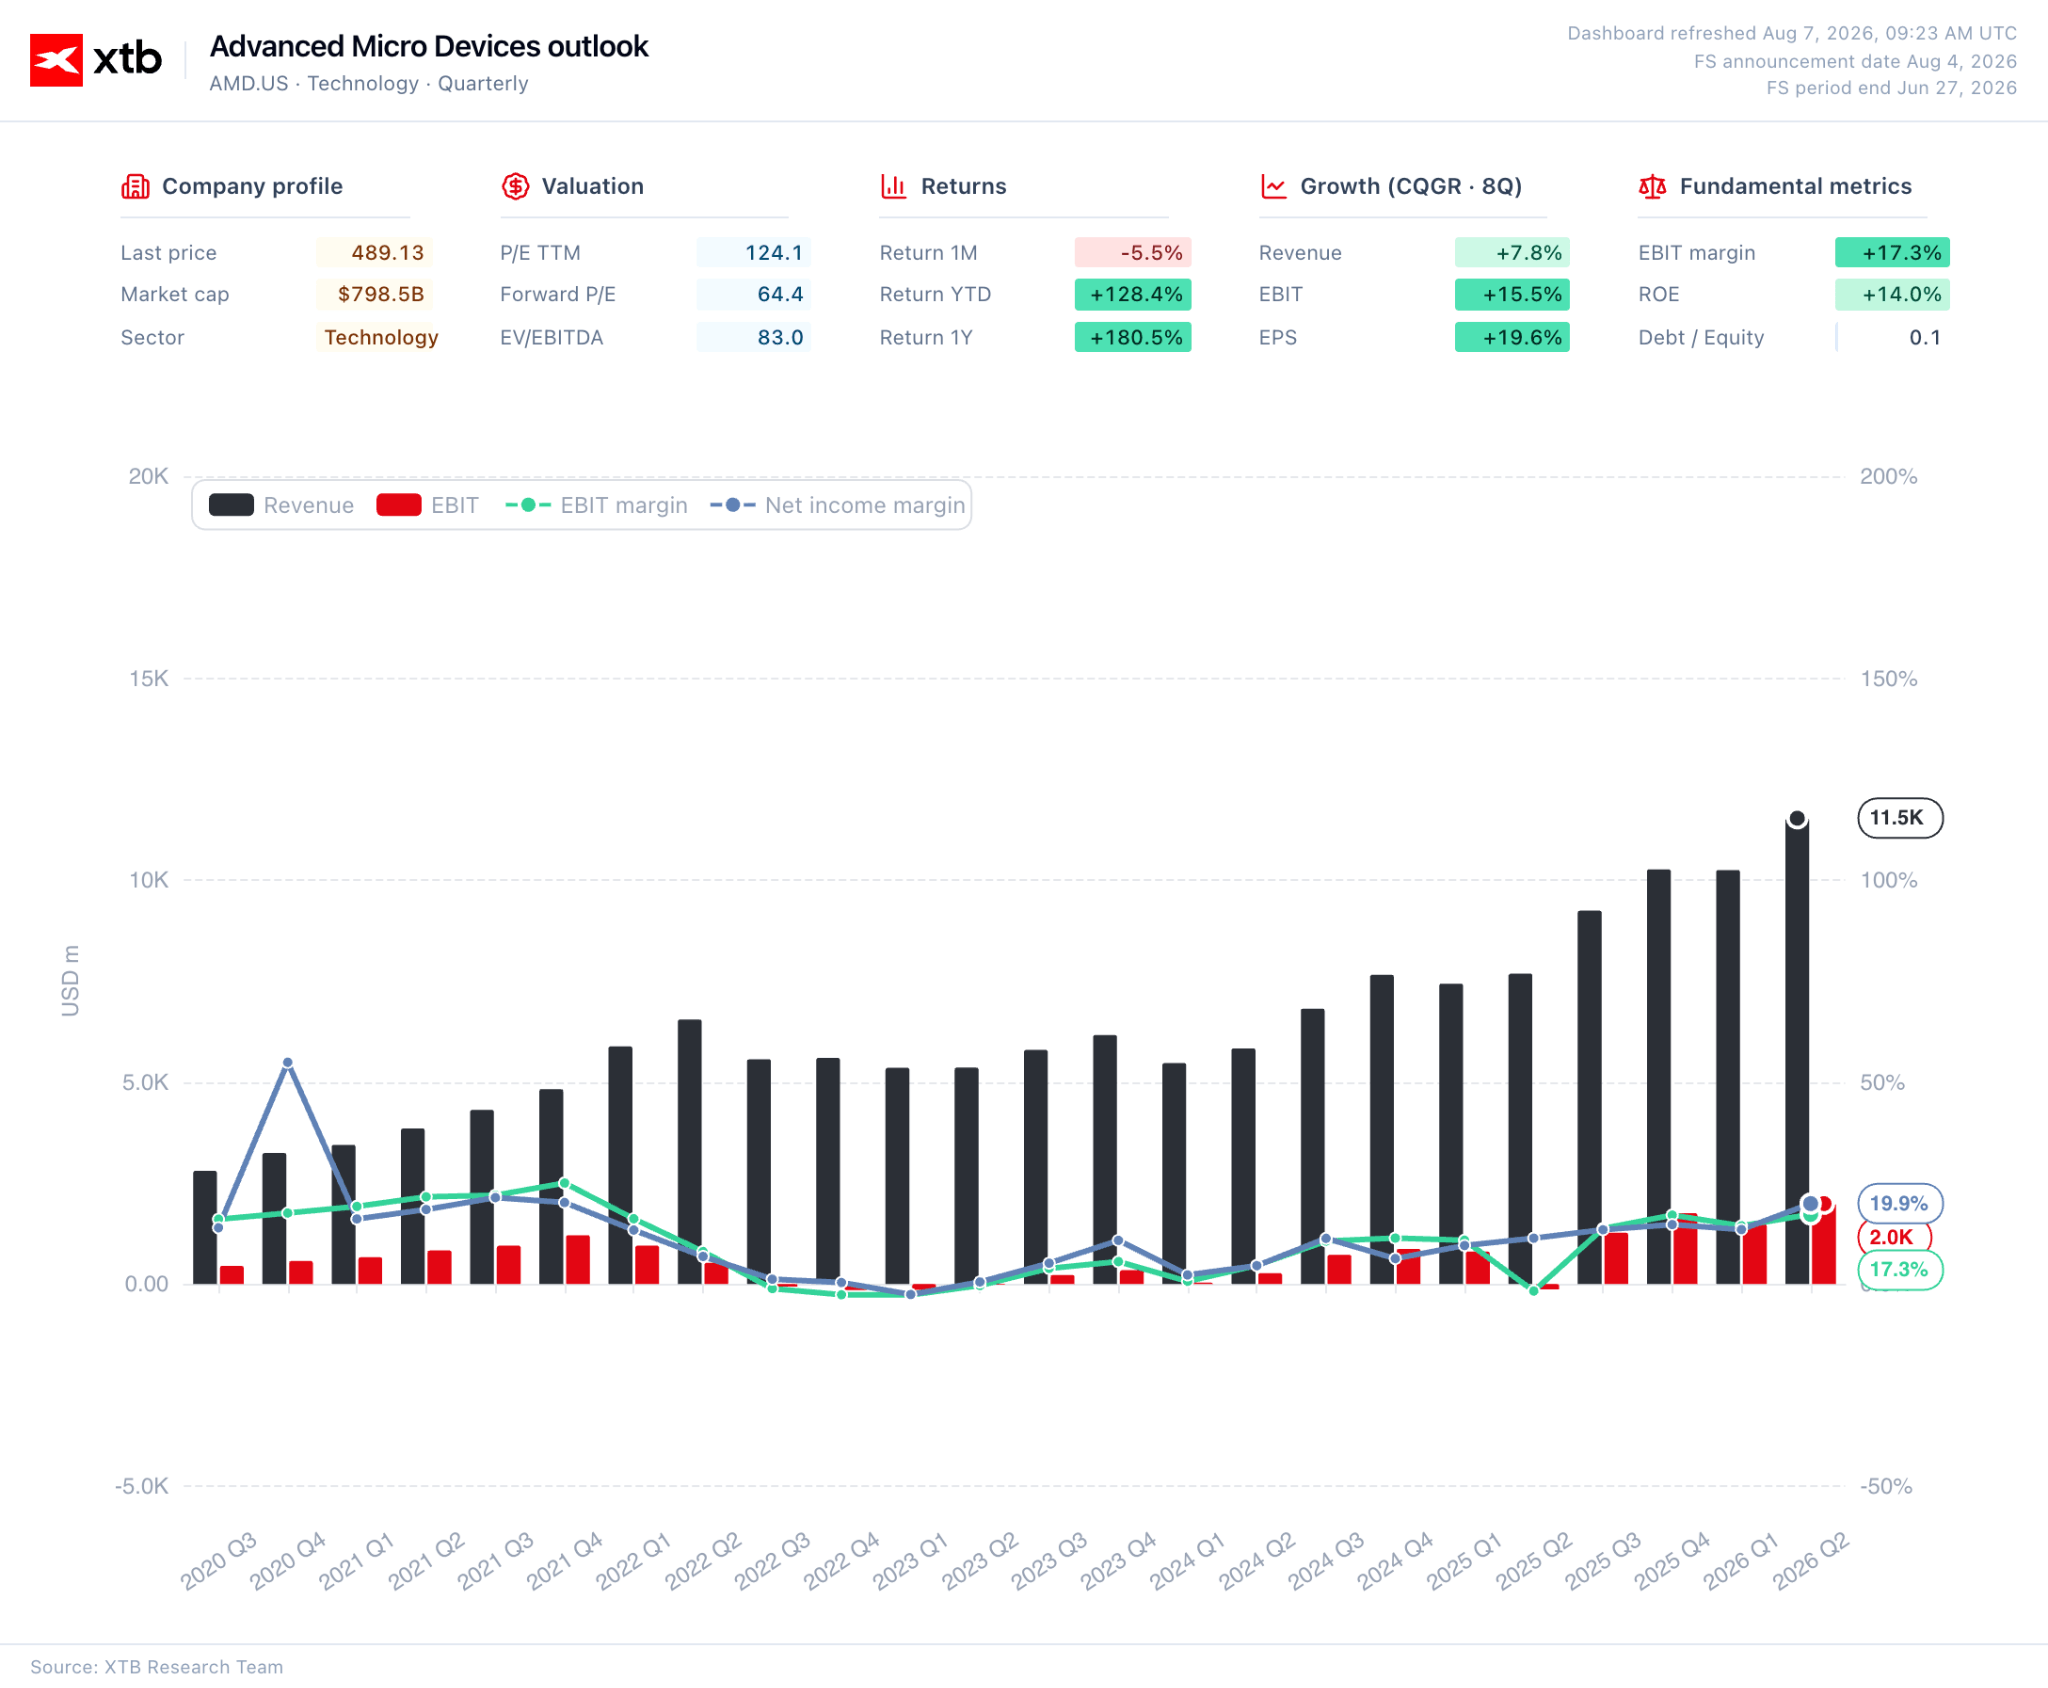
AMD's results, which, as we wrote on Wednesday, proved to be "merely" good, did not help.
- The company beat consensus in terms of both revenue and earnings per share. It also presented a better-than-expected forecast for the next quarter.
- However, its shares fell by over 10%, highlighting how high investor expectations are set and the strength of results companies in this sector must deliver just to sustain current valuations.
Figure 3: Dashboard for AMD (07.08.2026)
 Source: XTB Research, 07.08.2026
There are no further publications from giants remaining this week. The most significant attention today will likely be on reports from Take-Two Interactive, Wendy's, and Under Armour. Next week we look forward to, among others, readings from Plug Power (Monday) and Super Micro Computer (Tuesday), which are also unlikely to have significant potential to move the broader market.
📈 NFP Report
Today brings what is undoubtedly the most anticipated macroeconomic data release of the week. At 1:30 PM, the NFP data will be released, which is the most important report from the US labour market.
Following the July meeting, which brought neither a hike in interest rates nor greater clarity regarding further committee actions, market pricing for rate hikes fell significantly, which was decidedly supportive for the equity market.
Investors appear to be increasingly doubting that the hawkish communications from the new Fed Chair will be followed by concrete actions. Recall that almost exactly a year ago, Warsh openly sided with Trump, stating on FOX News that the President's frustration with Powell's conduct of monetary policy was fully justified. He criticised the institution at the time for being too slow to lower interest rates and overly reliant on lagging economic data.
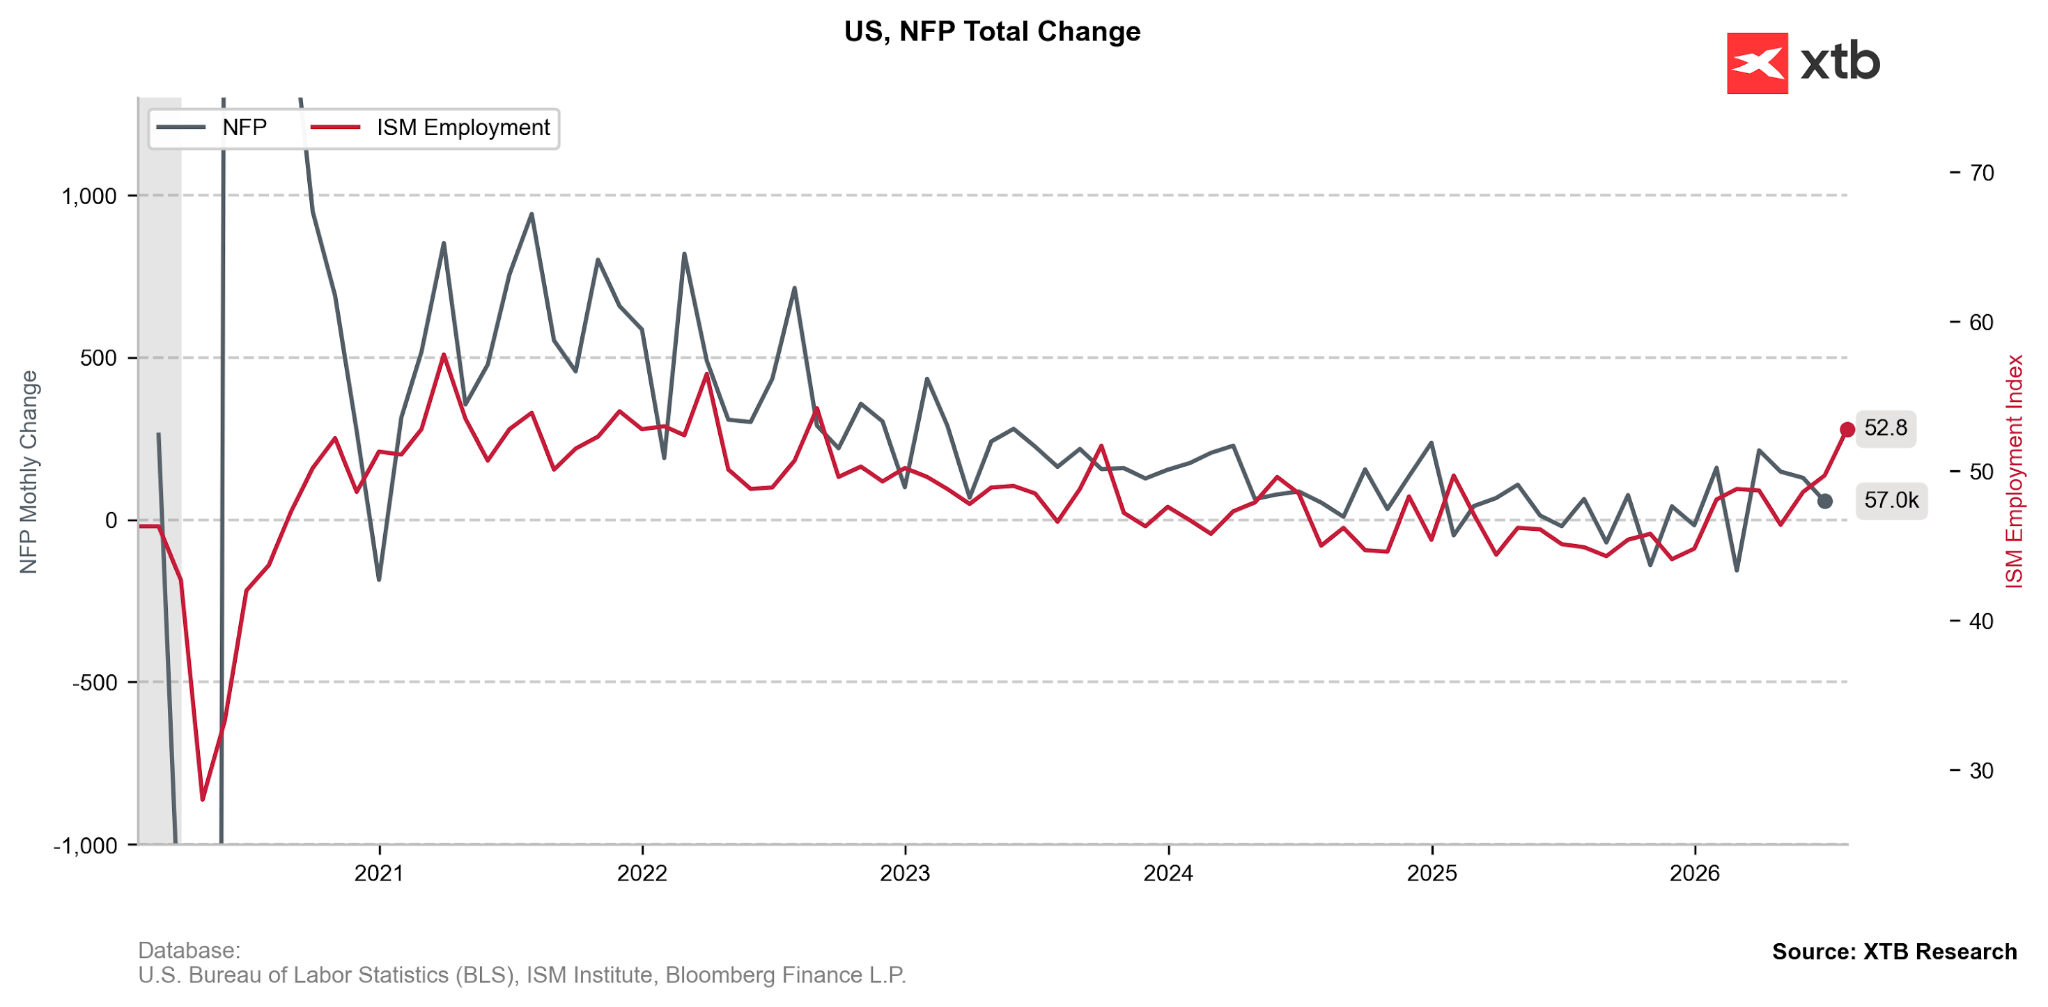
As the Fed must ensure both price stability and maximum employment, signals of a cooling US labour market could lead to a further dovish revision in the expected interest rate path in the USA. This is to some extent suggested by the ADP and JOLTS data published this week, both of which came in below market expectations. However, these are either data that are secondary under standard conditions (like ADP) or significantly delayed (like JOLTS). Furthermore, their correlation with the NFP reading has been relatively small in recent years.
Figure 4: NFP and ISM PMI Employment Component (2020 - 2026)
 Source: XTB Research, 07.08.2026
It is worth mentioning that economists have had a tendency in recent years to underestimate the number of new non-farm jobs. The NFP reading has ultimately proved better than expectations in as many as 35 of the last 50 months.
Technical Analysis
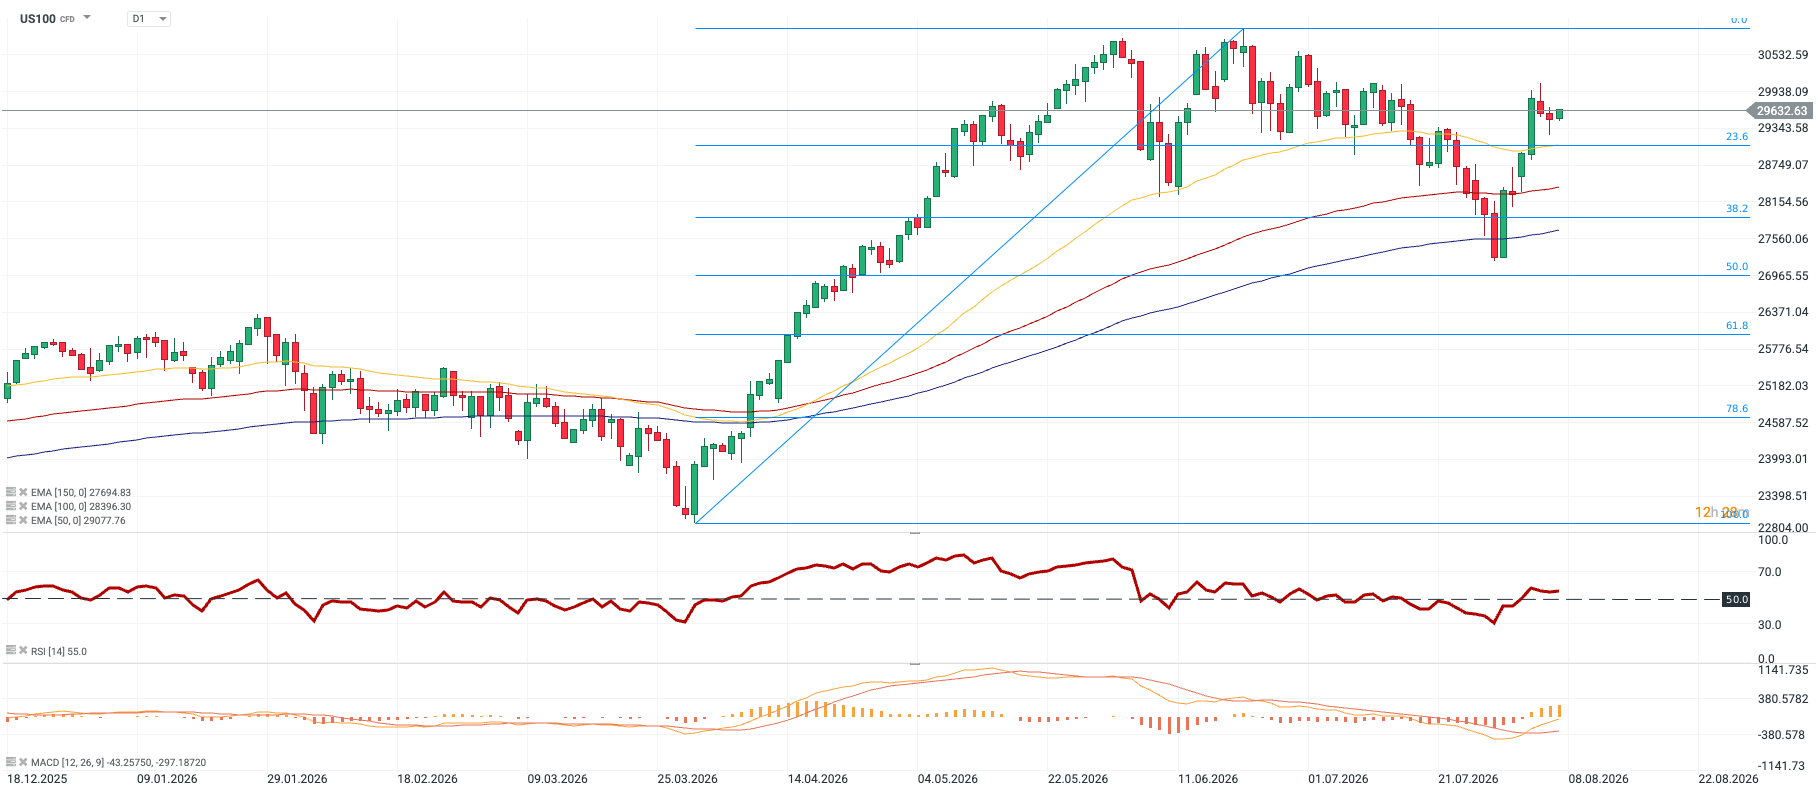
Figure 5: US100 [D1] (18.12.2025 - 07.08.2026)
 Source: xStation, 07.08.2026
The index has been in a clear, long-term upward trend since March 2026. After marking a local peak at the 30.76k level, it entered a natural downward correction phase, reducing part of its earlier gains. The current price oscillates around 29.6k, showing strong signs of completing the corrective move and returning to the main trend.
The key moment for the demand side was the successful defence of strategic support zones in the second half of July. In recent days, buyers have managed to push the price with momentum back above the 50-period exponential moving average (EMA 50, yellow line, level approx. 29077). This is a very significant technical signal, indicating that bulls have regained short-term control of the market.
This situation is confirmed by oscillatory indicators. The RSI indicator broke above the natural 50-point barrier from below, confirming the return of positive momentum. At the same time, it remains far from the overbought zone, which leaves plenty of room for the upward move to continue.
—
Michał Jóźwiak, Financial Markets Analyst at XTB



Market Wrap: Oil rises again, French fiscal concerns weigh on euro (07.10.2026)



Oil falls below $100🚨
💶Chart of the Day: EURUSD at Lowest Since May 2025 Amid French Fiscal Crisis

Morning Briefing: Dollar gains, oil falls. EURUSD at multi-month lows
The content of this report has been created by XTB S.A., with its registered office in Warsaw, at Prosta 67, 00-838 Warsaw, Poland, (KRS number 0000217580) and supervised by Polish Supervision Authority ( No. DDM-M-4021-57-1/2005). This material is a marketing communication within the meaning of Art. 24 (3) of Directive 2014/65/EU of the European Parliament and of the Council of 15 May 2014 on markets in financial instruments and amending Directive 2002/92/EC and Directive 2011/61/EU (MiFID II). Marketing communication is not an investment recommendation or information recommending or suggesting an investment strategy within the meaning of Regulation (EU) No 596/2014 of the European Parliament and of the Council of 16 April 2014 on market abuse (market abuse regulation) and repealing Directive 2003/6/EC of the European Parliament and of the Council and Commission Directives 2003/124/EC, 2003/125/EC and 2004/72/EC and Commission Delegated Regulation (EU) 2016/958 of 9 March 2016 supplementing Regulation (EU) No 596/2014 of the European Parliament and of the Council with regard to regulatory technical standards for the technical arrangements for objective presentation of investment recommendations or other information recommending or suggesting an investment strategy and for disclosure of particular interests or indications of conflicts of interest or any other advice, including in the area of investment advisory, within the meaning of the Trading in Financial Instruments Act of 29 July 2005 (i.e. Journal of Laws 2019, item 875, as amended). The marketing communication is prepared with the highest diligence, objectivity, presents the facts known to the author on the date of preparation and is devoid of any evaluation elements. The marketing communication is prepared without considering the client’s needs, his individual financial situation and does not present any investment strategy in any way. The marketing communication does not constitute an offer of sale, offering, subscription, invitation to purchase, advertisement or promotion of any financial instruments. XTB S.A. is not liable for any client’s actions or omissions, in particular for the acquisition or disposal of financial instruments, undertaken on the basis of the information contained in this marketing communication. In the event that the marketing communication contains any information about any results regarding the financial instruments indicated therein, these do not constitute any guarantee or forecast regarding the future results.