



- Bitcoin’s 30-day average Taker Buy Volume has fallen to levels previously seen in late 2020, around the 2022 bottom, and during the 2023 consolidation.
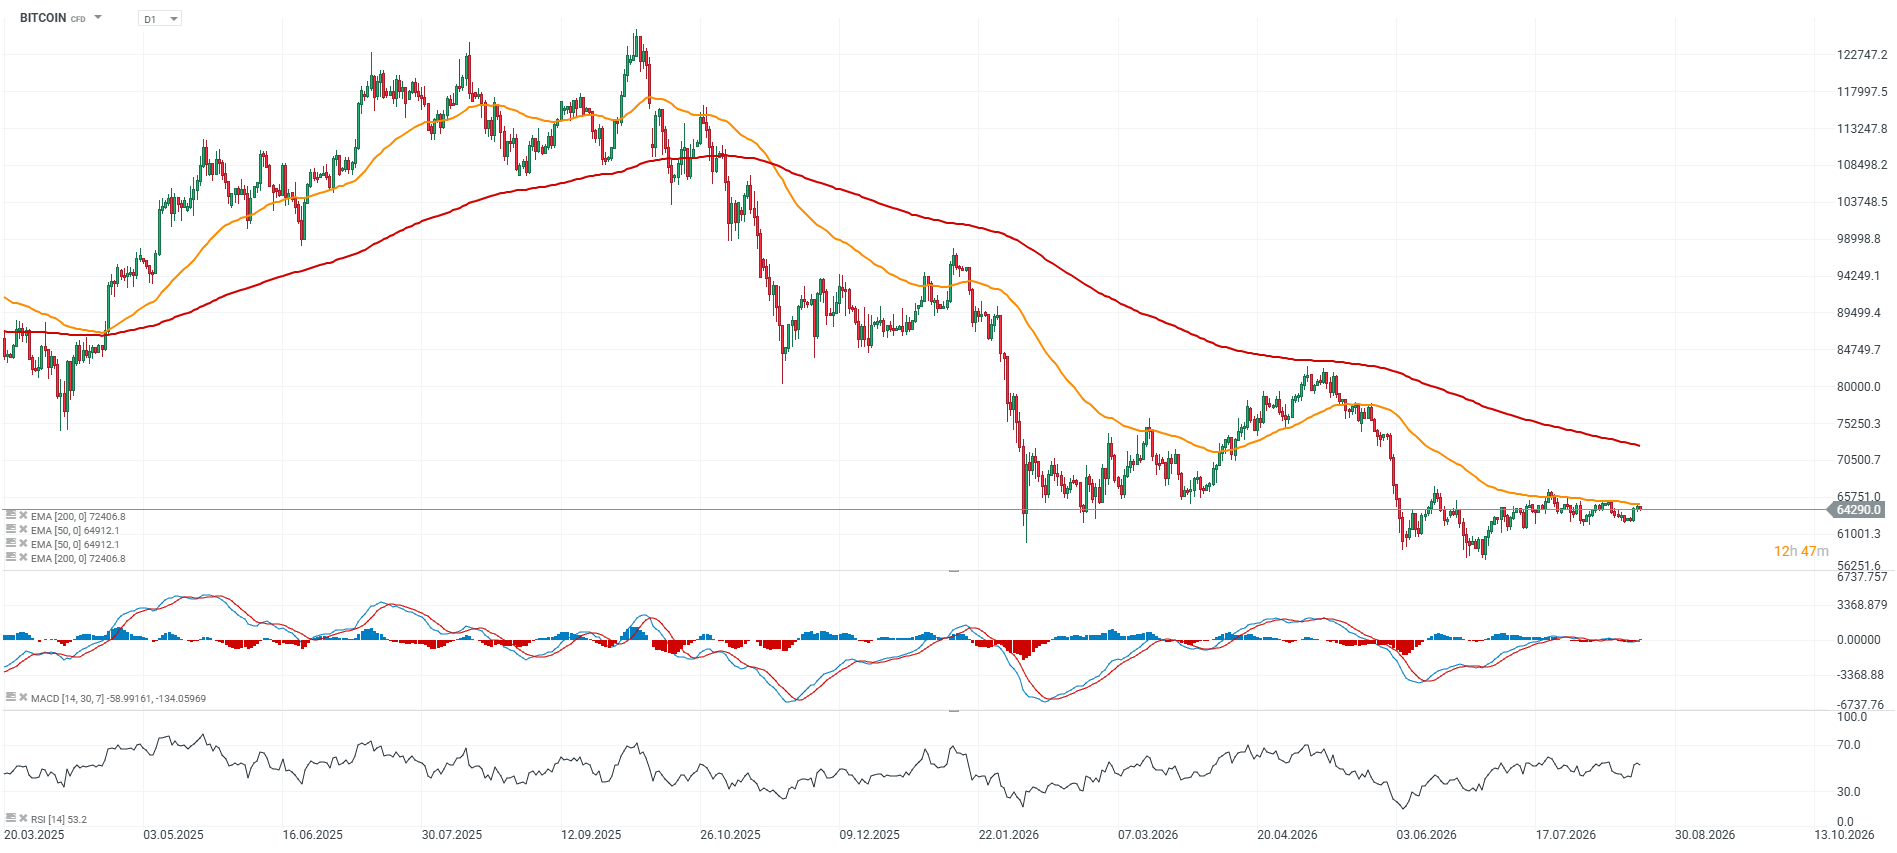
- The USD 62,000–63,000 zone remains the key support area, and a sustained break below it would shift attention toward USD 54,300.
- More than USD 200 million in liquidations over the past 24 hours confirms that the market is still going through a deleveraging process.
- High bond yields and weakness on Wall Street are putting pressure on risk assets, even as institutional infrastructure around Bitcoin continues to develop.
- Bitcoin’s correlation with global equity markets is declining, making it increasingly difficult to link short-term crypto price swings directly to macro conditions or stock-market volatility.
Bitcoin price chart (D1 interval) and ETF inflows
A break above USD 65,500 and the key resistance around the 50-day EMA (orange line) could open the way toward roughly USD 70,000. That area could become the key battleground between buyers and sellers — potentially determining whether Bitcoin sees another strong bearish impulse or whether the bottom of this year’s bear market is already behind us. On the downside, price action continues to support the view that USD 62,000 is an important support zone.
Source: xStation5
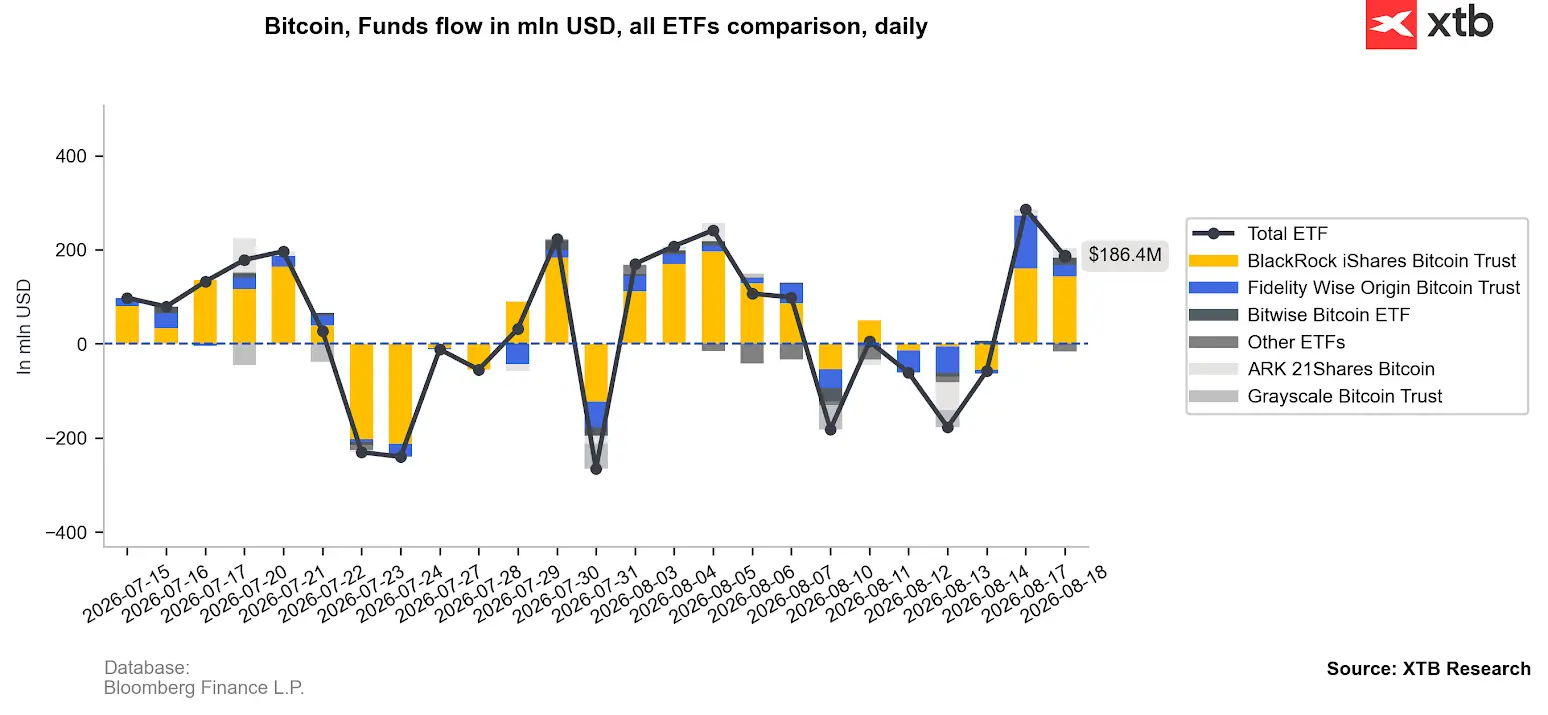
Flows into spot Bitcoin ETFs remain volatile, but the latest sessions have brought a clear improvement. After several periods of outflows, at times exceeding USD 200 million per day, total inflows rebounded to around USD 186.4 million. BlackRock’s iShares Bitcoin Trust continues to account for the largest share of positive flows, with additional support from Fidelity’s fund. The key takeaway is that despite weaker sentiment around Bitcoin itself, ETF demand has not disappeared and has started to recover again in recent days. This weakens the narrative of a full-scale institutional withdrawal from BTC.
Source: XTB Research
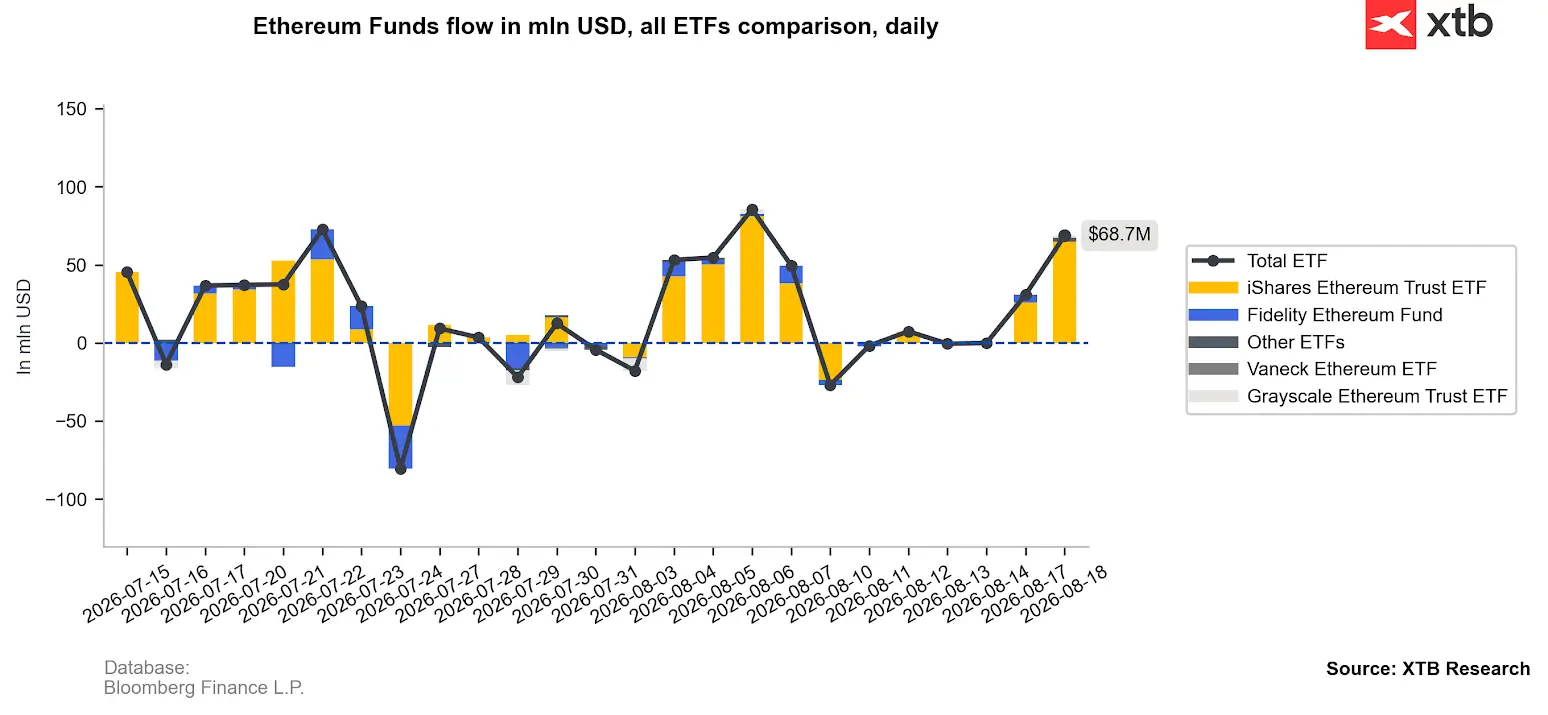
Ethereum ETF flows are significantly smaller than Bitcoin’s, but the latest sessions have also shown improvement. The most recent reading shows around USD 68.7 million in daily inflows, following roughly USD 30 million on Monday and an earlier period of mixed flows and occasional outflows. The iShares Ethereum Trust ETF accounts for the largest share of positive flows, while the remaining funds play a much smaller role. Importantly, over the past few months positive flows have increasingly appeared for several sessions in a row, which may indicate a gradual return of interest in Ethereum after a weaker start to August. The scale remains modest, but the direction of flows is clearly more constructive than it was a few weeks ago.
Source: XTB Research
Bitcoin demand is weakening
CryptoQuant, a firm specializing in on-chain data analysis, points to Bitcoin’s 30-day average Taker Buy Volume, which has fallen to levels seen previously at important points in the cycle. A decline in this indicator means lower activity from aggressive buyers and a stronger relative position for sellers. This does not automatically signal the beginning of a major sell-off. Similar readings have appeared during both capitulation and accumulation phases, but a more credible bottoming signal would require price stabilization alongside a rebound in Taker Buy Volume. For now, it is better interpreted as a sign of exhausted activity rather than confirmation of a trend reversal.
More than 2 million BTC changed hands in the USD 62,000–63,000 area, creating a large concentration of investor cost basis. Bitcoin unsuccessfully tried to stay above USD 65,000. At the same time, trading volume on major exchanges fell by around 10% over the past 24 hours, meaning the rebound is not being supported by particularly strong fresh demand. If the USD 62,000–63,000 zone holds, the market may still enter a stabilization phase. If it breaks under rising selling pressure, the next area in focus is around USD 54,276.
More than USD 200 million in crypto positions were liquidated over the past 24 hours, mostly longs. At the same time, Bitcoin open interest fell by around 0.53%, which, alongside a relatively stable price, may indicate partial short covering. This still does not mean that strong demand has returned. The Crypto Fear & Greed Index remains in fear territory, while crypto-related equities also came under pressure: Strategy fell by more than 5% yesterday, while Bitmine Immersion Technologies lost around 2.3%.
Bitcoin’s problem is only partly macroeconomic
Samsung Electronics and SK Hynix fell by more than 7% in Seoul, the Kospi lost around 6%, MSCI Asia Pacific declined by about 2%, and the Asian semiconductor index dropped by more than 3%. A day earlier, the Philadelphia Semiconductor Index fell by around 5%. Bonds may be even more important. The yield on 30-year U.S. Treasuries rose to its highest level since 2007, while the 10-year yield remained around 4.69%.
Such an environment raises the cost of capital and reduces the attractiveness of risk assets, even if it does not trigger an immediate price reaction. The market is also waiting for the minutes from the Fed’s July meeting and Kevin Warsh’s speech at Jackson Hole. According to a Reuters survey, 94 out of 104 economists expect the Fed to keep rates in the 3.5–3.75% range in September, while markets are pricing in around a 68% probability of no change.
Citi and Zhizao show the other side of the market?
Institutional adoption continues in the background despite the short-term weakness. Citi is preparing to launch a digital-asset custody service under its Custody+ platform, designed to bring traditional assets and cryptocurrencies into a single infrastructure. The bank is also developing tokenized deposits, cooperating with ICE, participating in a SWIFT pilot, and taking part in The Clearing House project.
At the same time, Nasdaq-listed Zhizao Technology completed a USD 154.7 million transaction and launched a Bitcoin treasury strategy covering 2,380 BTC. Bitcoin was valued at a reference price of USD 65,000 in the transaction. According to BitcoinTreasuries.net, the company became the 33rd-largest corporate holder of Bitcoin, although its shares did not respond positively. The stock remains down around 77% year to date.
Short-term demand for BTC is weakening, but the long-term infrastructure around Bitcoin continues to expand. The market failed to hold USD 65,000, on-chain data does not yet confirm a recovery in demand, and the macro backdrop remains unfavorable. That is why the behavior around USD 62,000 may matter more than any single daily rebound. Holding this support alongside an improvement in Taker Buy Volume would support an accumulation scenario, while a break below the zone under rising supply would significantly increase the probability of a deeper correction.
Ethereum and 20-day ETF flows – capital is rebuilding faster than price
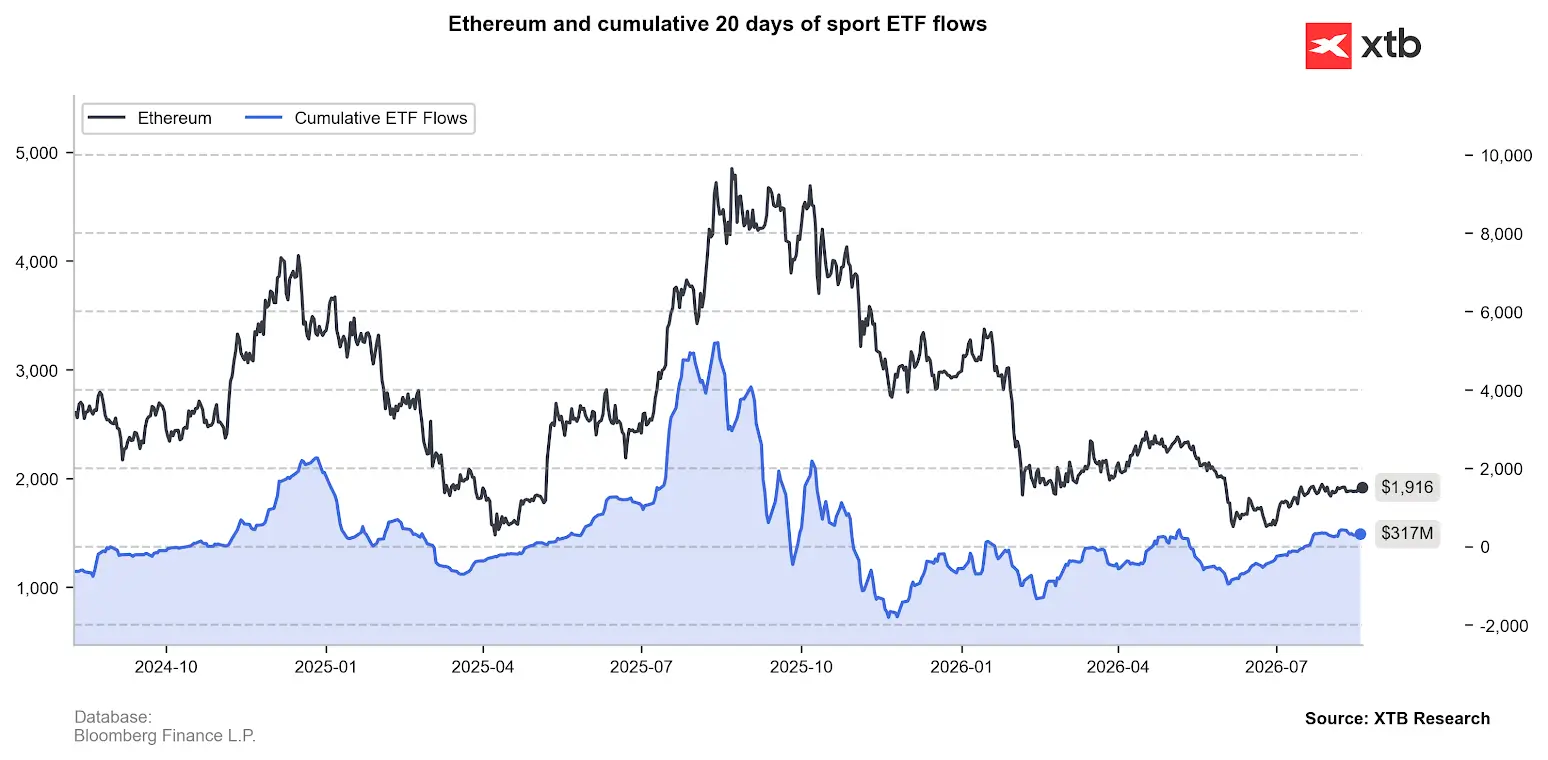
The most interesting signal comes from comparing Ethereum’s price with cumulative 20-day spot ETF flows. ETH remains close to USD 1,900, well below its 2025 highs, while the 20-day flow balance has climbed back to around USD 317 million. This points to an improvement in fund demand even though price itself has not yet confirmed a stronger uptrend. Historically, flows and price have tended to move in the same direction, although not always at the same time, which makes the current divergence worth watching. If positive inflows continue over the coming weeks, they could become an early sign of improving institutional demand, although for now this is not yet a confirmed signal of a lasting trend reversal.
Source: XTB Research



Market Wrap: Rebound in China and Falling Oil Prices, France Leads EU Declines



Optimism Returns to Asia❔


Daily Summary: Friday offers no relief; the US100 drops 2%🚨


Three Markets to Watch Next Week (October 16, 2026)
The content of this report has been created by XTB S.A., with its registered office in Warsaw, at Prosta 67, 00-838 Warsaw, Poland, (KRS number 0000217580) and supervised by Polish Supervision Authority ( No. DDM-M-4021-57-1/2005). This material is a marketing communication within the meaning of Art. 24 (3) of Directive 2014/65/EU of the European Parliament and of the Council of 15 May 2014 on markets in financial instruments and amending Directive 2002/92/EC and Directive 2011/61/EU (MiFID II). Marketing communication is not an investment recommendation or information recommending or suggesting an investment strategy within the meaning of Regulation (EU) No 596/2014 of the European Parliament and of the Council of 16 April 2014 on market abuse (market abuse regulation) and repealing Directive 2003/6/EC of the European Parliament and of the Council and Commission Directives 2003/124/EC, 2003/125/EC and 2004/72/EC and Commission Delegated Regulation (EU) 2016/958 of 9 March 2016 supplementing Regulation (EU) No 596/2014 of the European Parliament and of the Council with regard to regulatory technical standards for the technical arrangements for objective presentation of investment recommendations or other information recommending or suggesting an investment strategy and for disclosure of particular interests or indications of conflicts of interest or any other advice, including in the area of investment advisory, within the meaning of the Trading in Financial Instruments Act of 29 July 2005 (i.e. Journal of Laws 2019, item 875, as amended). The marketing communication is prepared with the highest diligence, objectivity, presents the facts known to the author on the date of preparation and is devoid of any evaluation elements. The marketing communication is prepared without considering the client’s needs, his individual financial situation and does not present any investment strategy in any way. The marketing communication does not constitute an offer of sale, offering, subscription, invitation to purchase, advertisement or promotion of any financial instruments. XTB S.A. is not liable for any client’s actions or omissions, in particular for the acquisition or disposal of financial instruments, undertaken on the basis of the information contained in this marketing communication. In the event that the marketing communication contains any information about any results regarding the financial instruments indicated therein, these do not constitute any guarantee or forecast regarding the future results.