



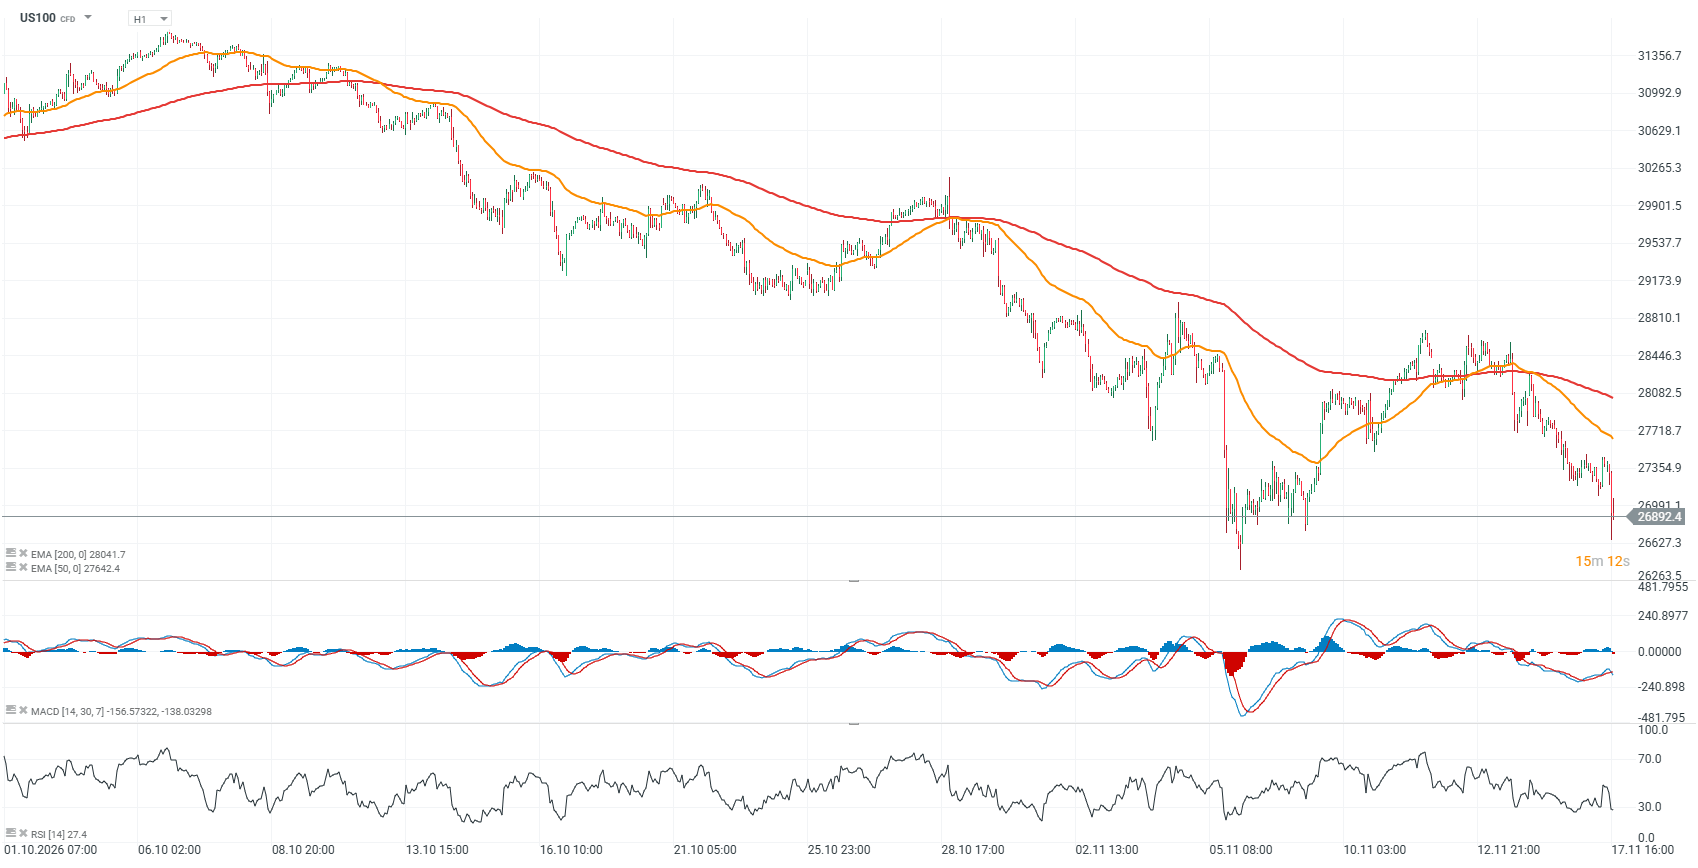
Nasdaq 100 futures (US100) are falling nearly 1.5% amid growing risks of further Fed rate hikes, uncertainty surrounding Nvidia's earnings report (due today after the US market close), and escalating tensions in the Middle East. The technical picture is deteriorating on both the hourly and daily charts, as the V-shaped recovery has ultimately failed and futures are now testing recent lows around 26,600 points. A deeper sell-off could follow if Nvidia's results, management commentary, or outlook for the coming quarters fail to meet market expectations.
Nvidia's earnings report appears set to be the most important catalyst for equity market volatility today, with the potential to move Wall Street sharply in either direction. If the company reports earnings and revenue above expectations and, as has traditionally been the case, raises its guidance for the coming quarters, we could see a relief rally across the technology sector. Disappointing results, however, could prolong the ongoing correction in US equities. On the one hand, fundamentals continue to provide support, as price-to-earnings multiples have compressed significantly. On the other hand, negative sentiment could persist in an uncertain macroeconomic environment that remains unfavorable for equities.
US100 (H1 timeframe)
Nasdaq 100 futures are testing the lows established during recent sharply negative sessions, while the RSI has once again fallen below 30, indicating oversold conditions. The key development to watch will be whether the index can stabilize within the 26,600–27,000 range and rebound from these levels, potentially forming a double-bottom pattern. Conversely, a break below 26,300 points could trigger an accelerated wave of selling and potentially initiate another leg lower.
 Source: XTB
Nasdaq 100: Valuations at their lowest since 2020 despite elevated index levels
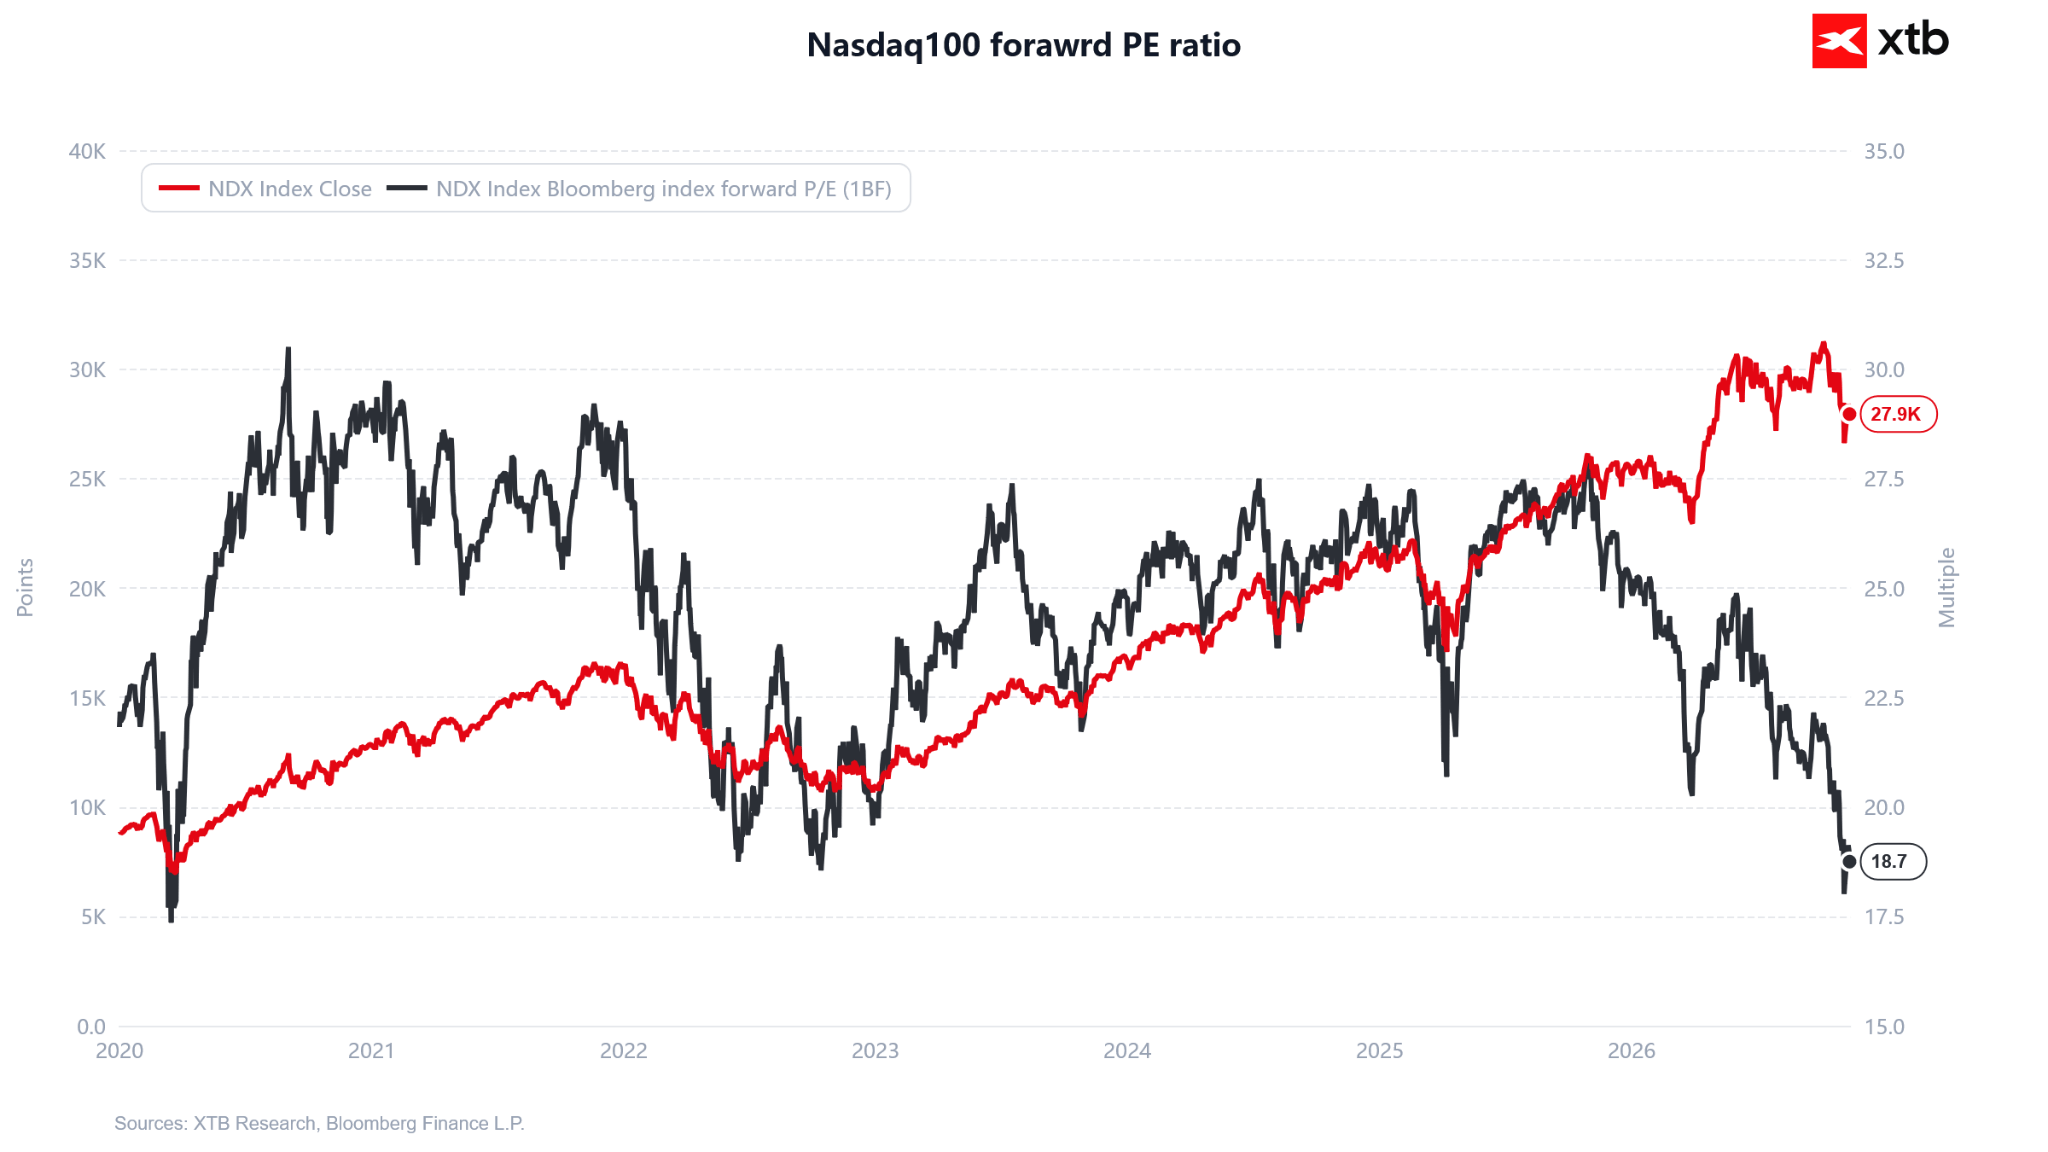
The Nasdaq 100's forward P/E ratio has fallen to just 18.7x, reaching one of its lowest levels since early 2020, even as the index remains near 28,000 points, substantially higher than six years ago. Such pronounced multiple compression suggests that expected earnings among technology companies have grown considerably faster than their market capitalizations in recent years, fundamentally changing the valuation picture for the US technology sector. Importantly, current valuations are even lower than during the 2022 bear market, when investors were concerned about rapidly rising interest rates, an economic slowdown, and deteriorating corporate earnings. From a long-term investment perspective, this could indicate an improving potential risk-reward profile, provided that projected earnings materialize, as downward revisions to analysts' expectations could quickly undermine the apparent attractiveness of current valuations.
 Source: XTB Research
Nasdaq 100: Market breadth signals weakening buying pressure
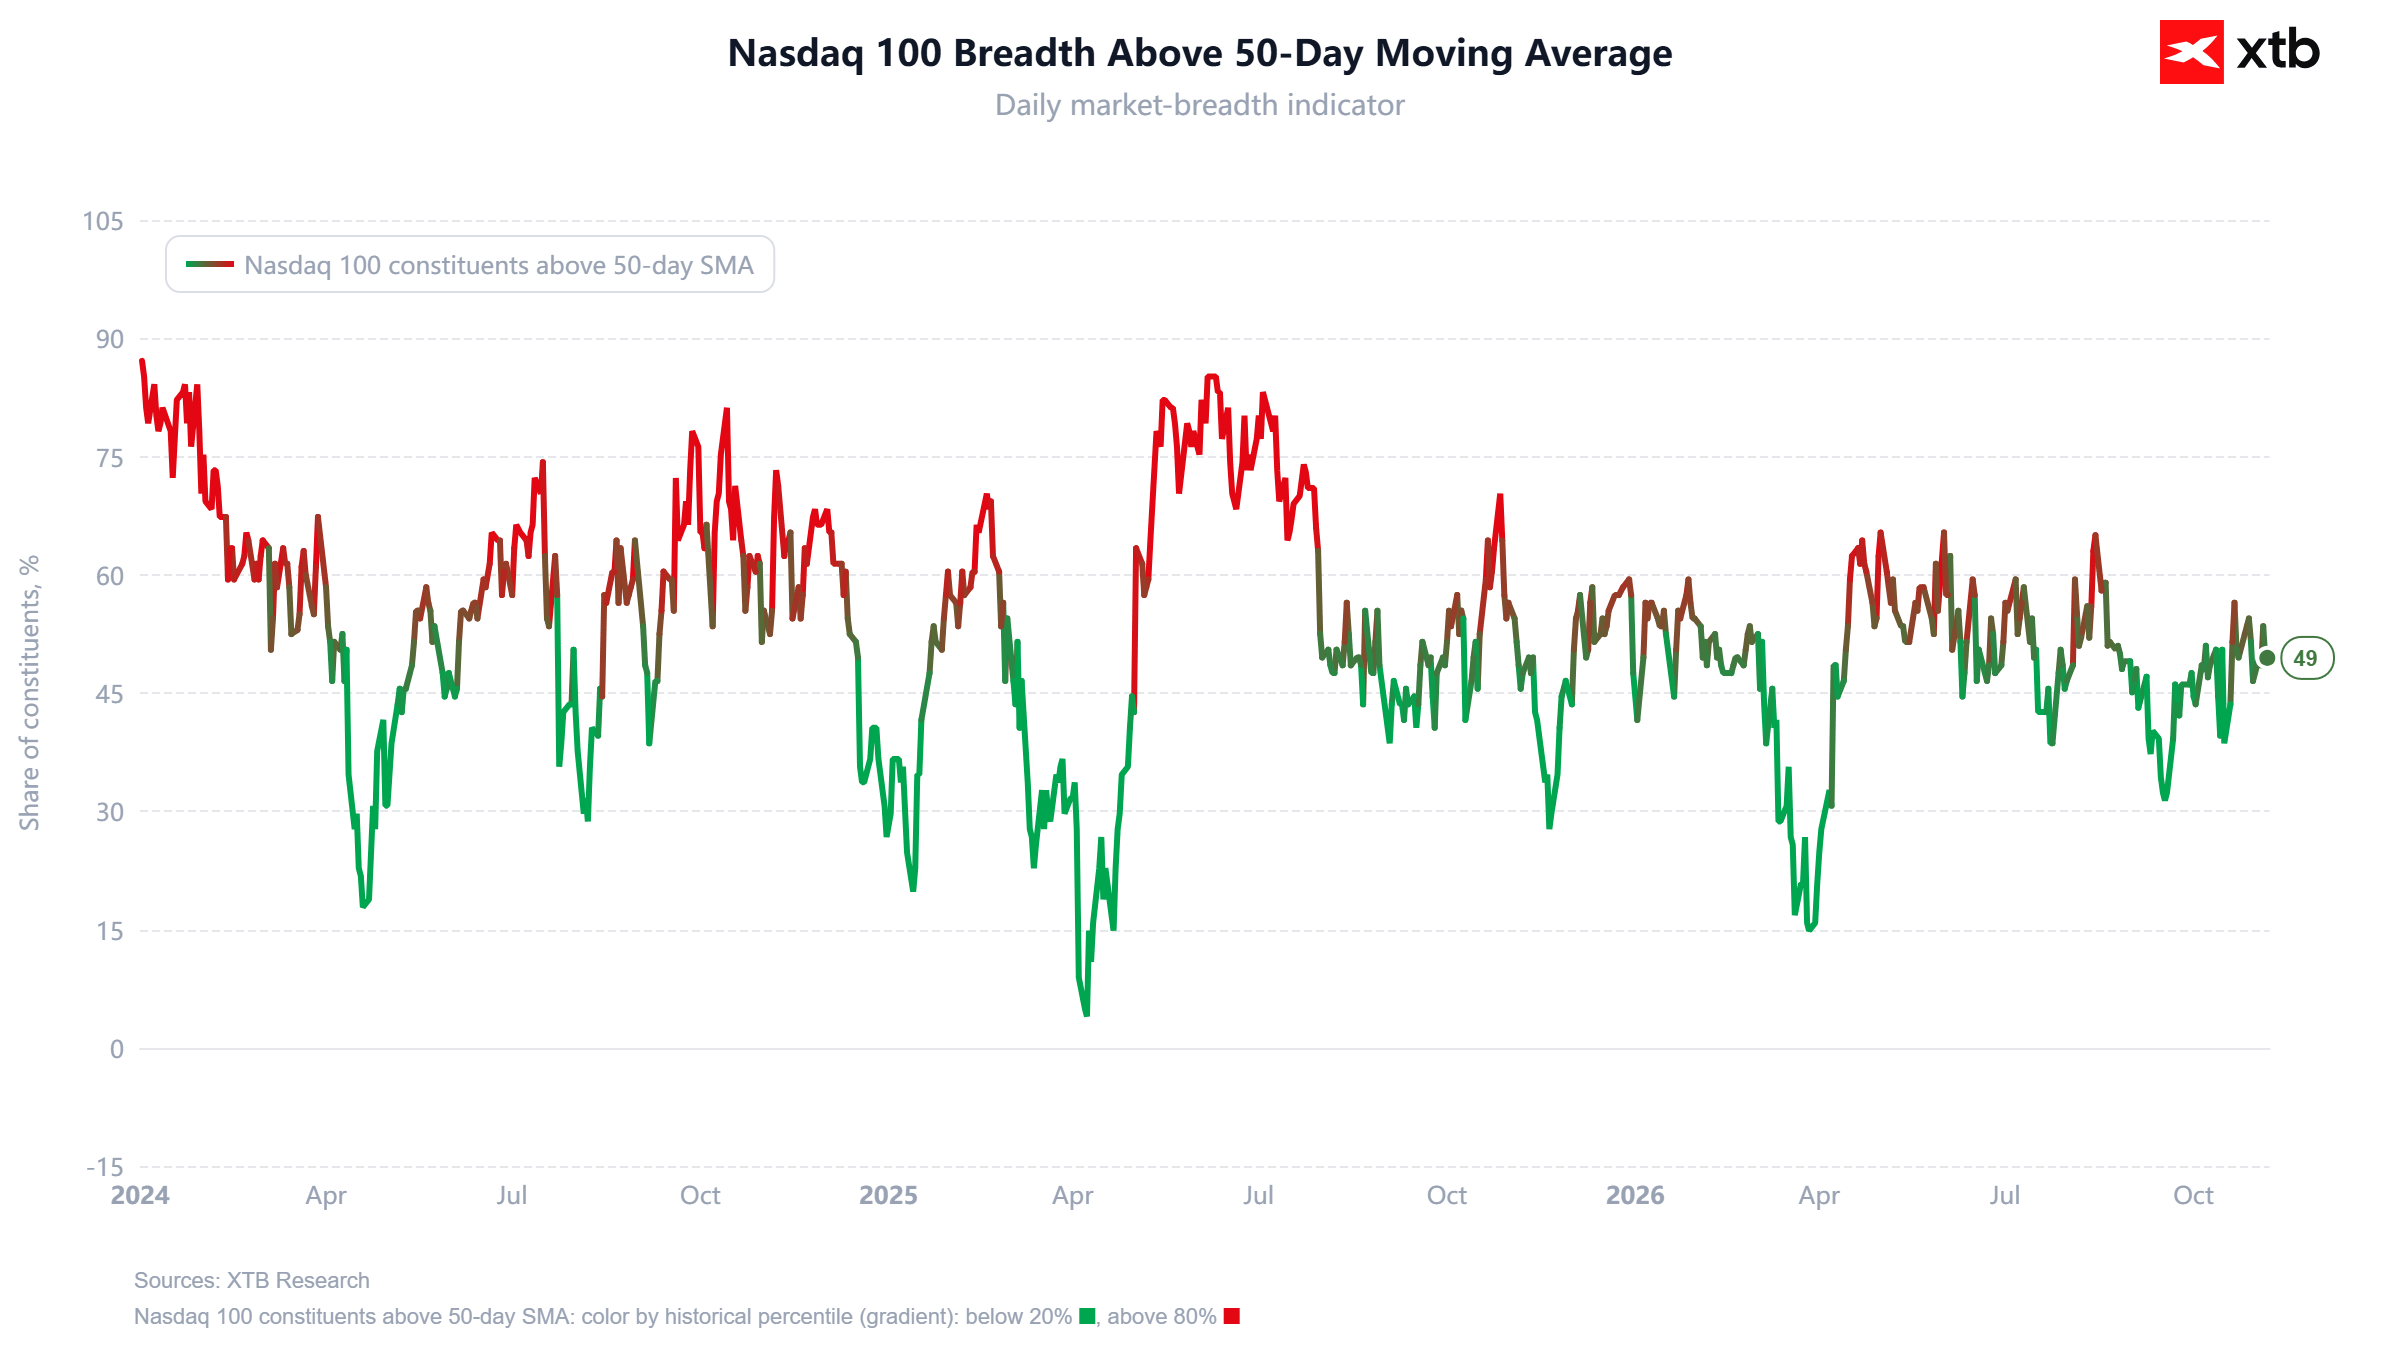
Despite the Nasdaq 100 remaining at relatively elevated levels, only 49% of its constituent companies are currently trading above their 50-day moving averages, indicating limited market breadth and a lack of broad participation in market gains. Since mid-2025, this indicator has gradually deteriorated, suggesting that an increasingly narrow group of the largest technology companies has been responsible for supporting the index. Historically, readings below 20–30% have accompanied significant market corrections but have also frequently preceded sharp rebounds as selling pressure began to ease. The current reading near 50% does not yet indicate extreme oversold conditions, but it points to a fragile uptrend and greater vulnerability to further declines if the index's largest constituents weaken.
Source: XTB Research
S&P 500 and forward P/E ratio (1990–2026)
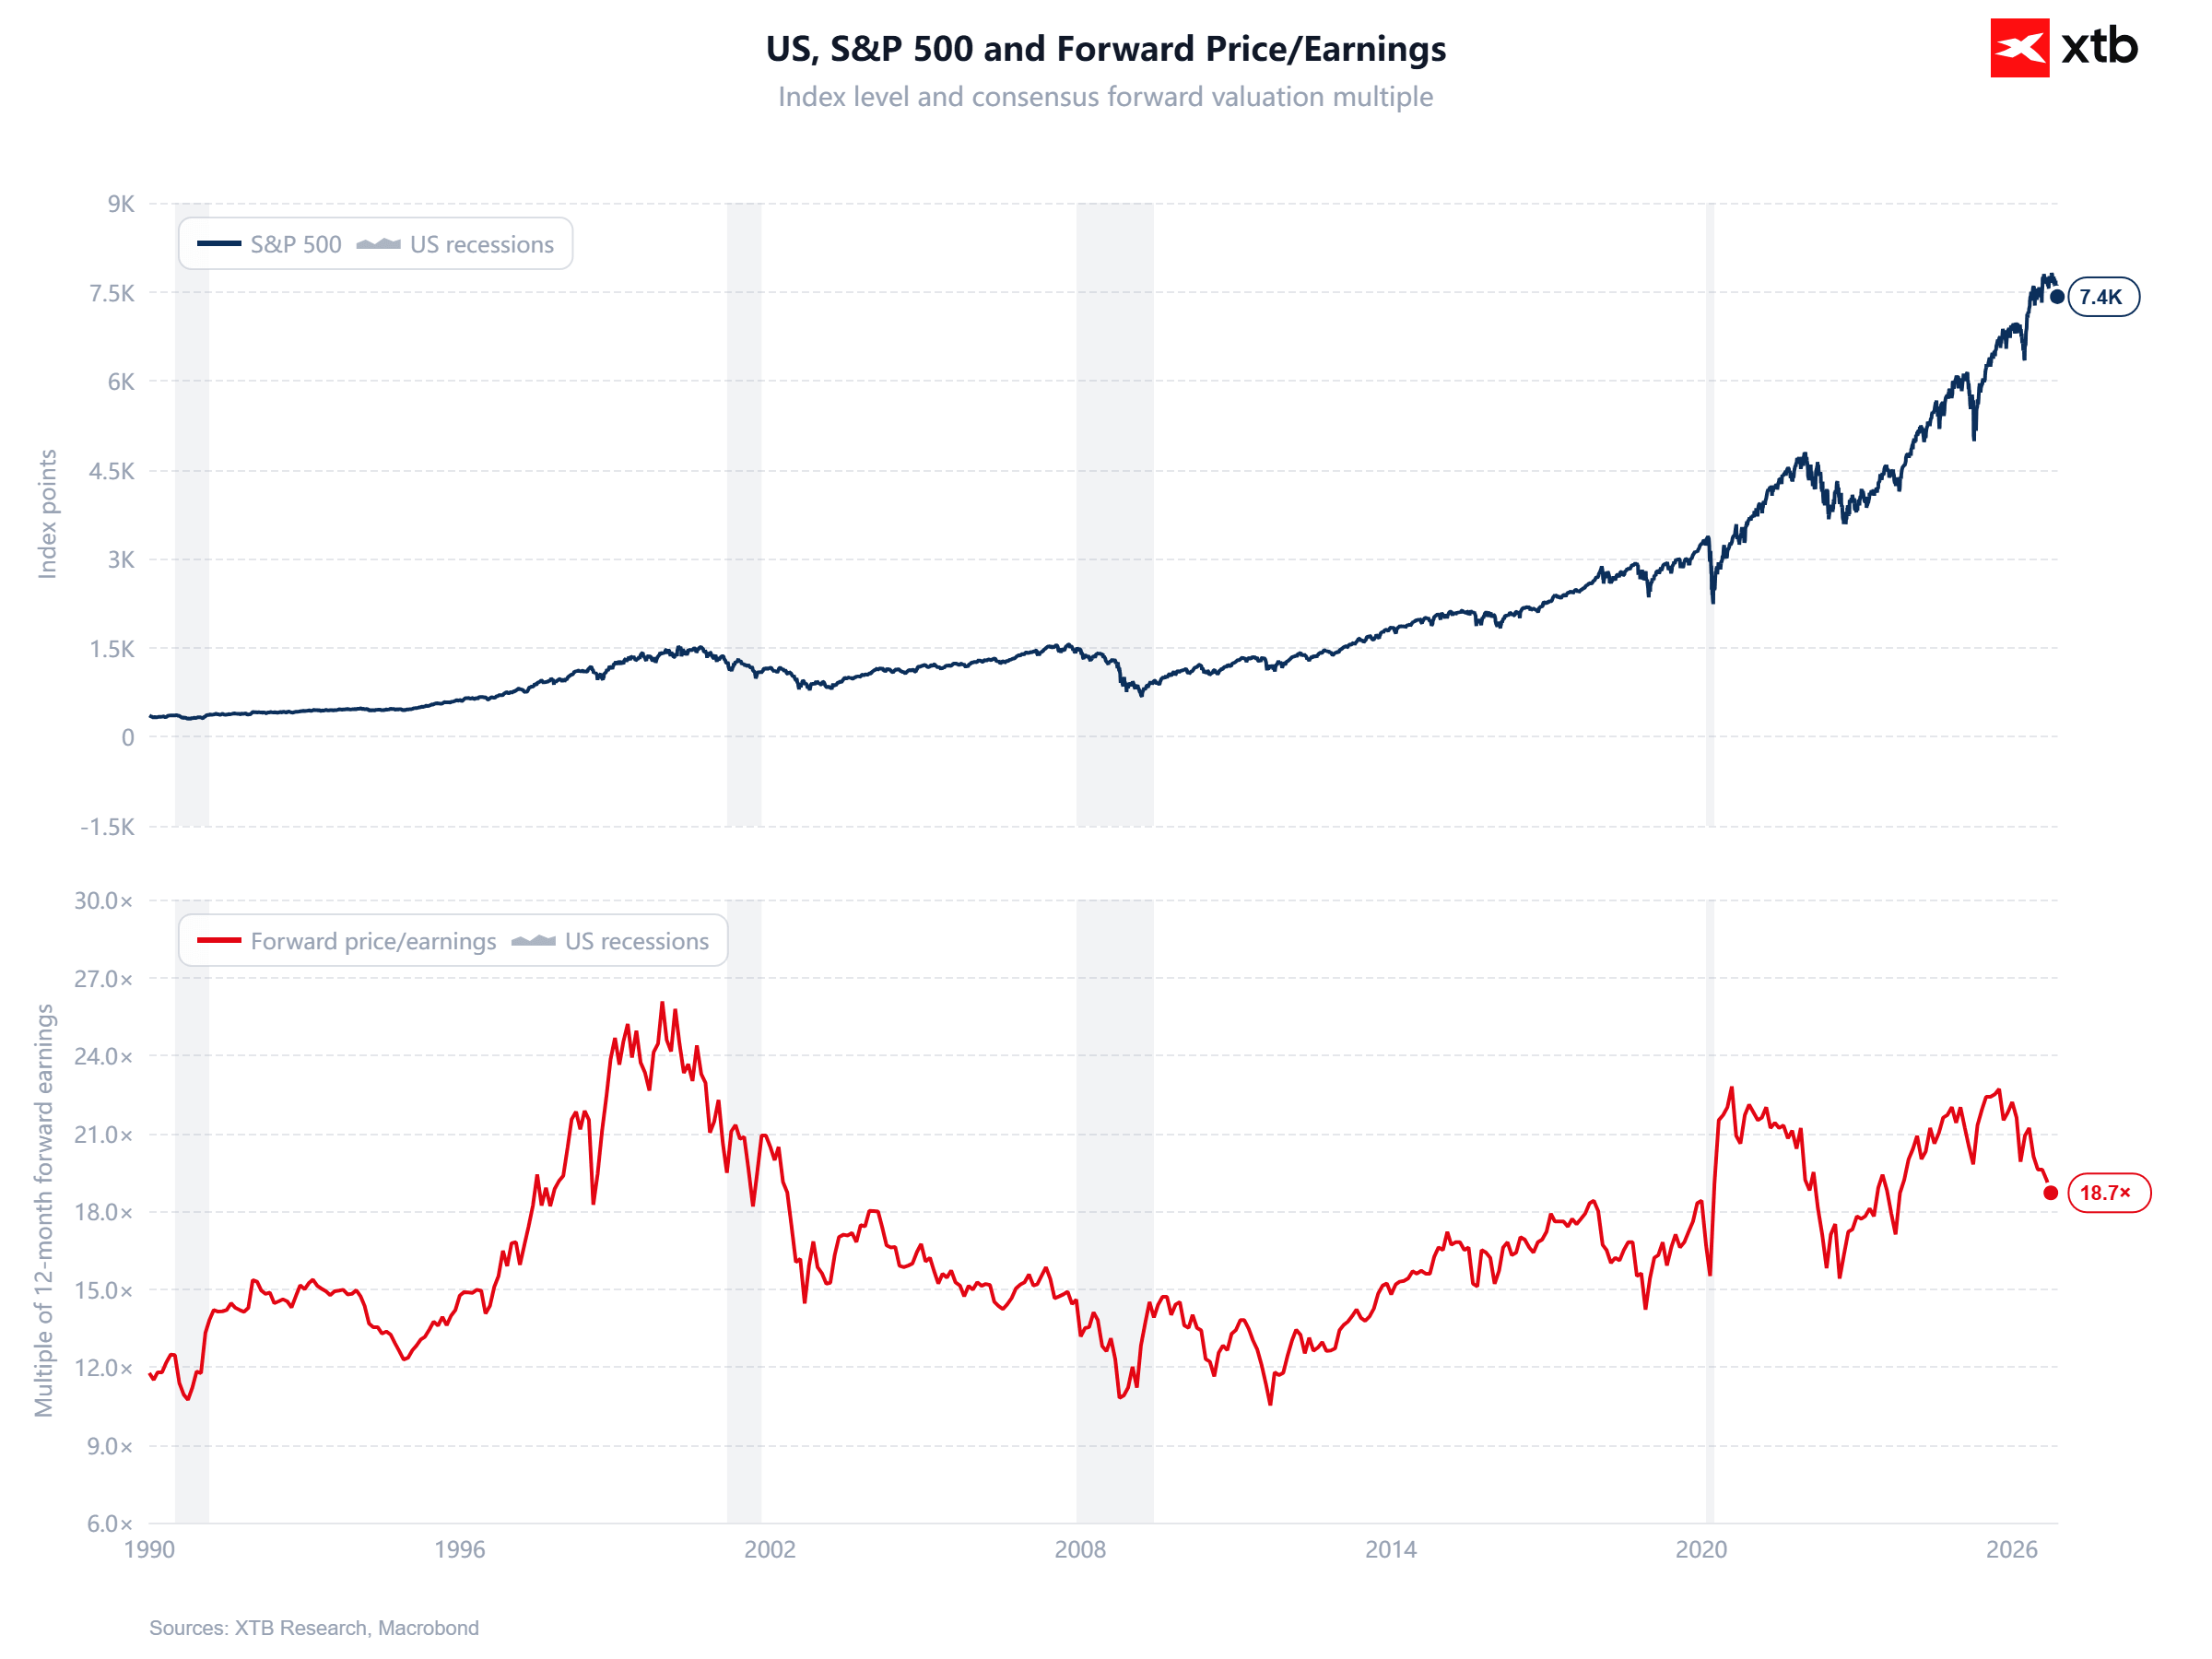
Despite the S&P 500 approaching historical highs, its valuation measured by the forward P/E ratio has declined to 18.7x, suggesting that expected corporate earnings growth has recently outpaced share price appreciation. The current multiple remains well below the extremes of the dot-com bubble around the turn of the century and the levels observed in 2020–2021, although it still exceeds valuations recorded during many earlier periods. From a long-term investment perspective, a declining forward P/E ratio alongside relatively elevated index levels may indicate an improving relationship between share prices and expected earnings, rather than necessarily signaling deteriorating market prospects. At the same time, the attractiveness of current valuations depends on companies delivering the earnings analysts expect, as downward revisions could quickly undermine Wall Street's current fundamental outlook.
 Source: XTB Research
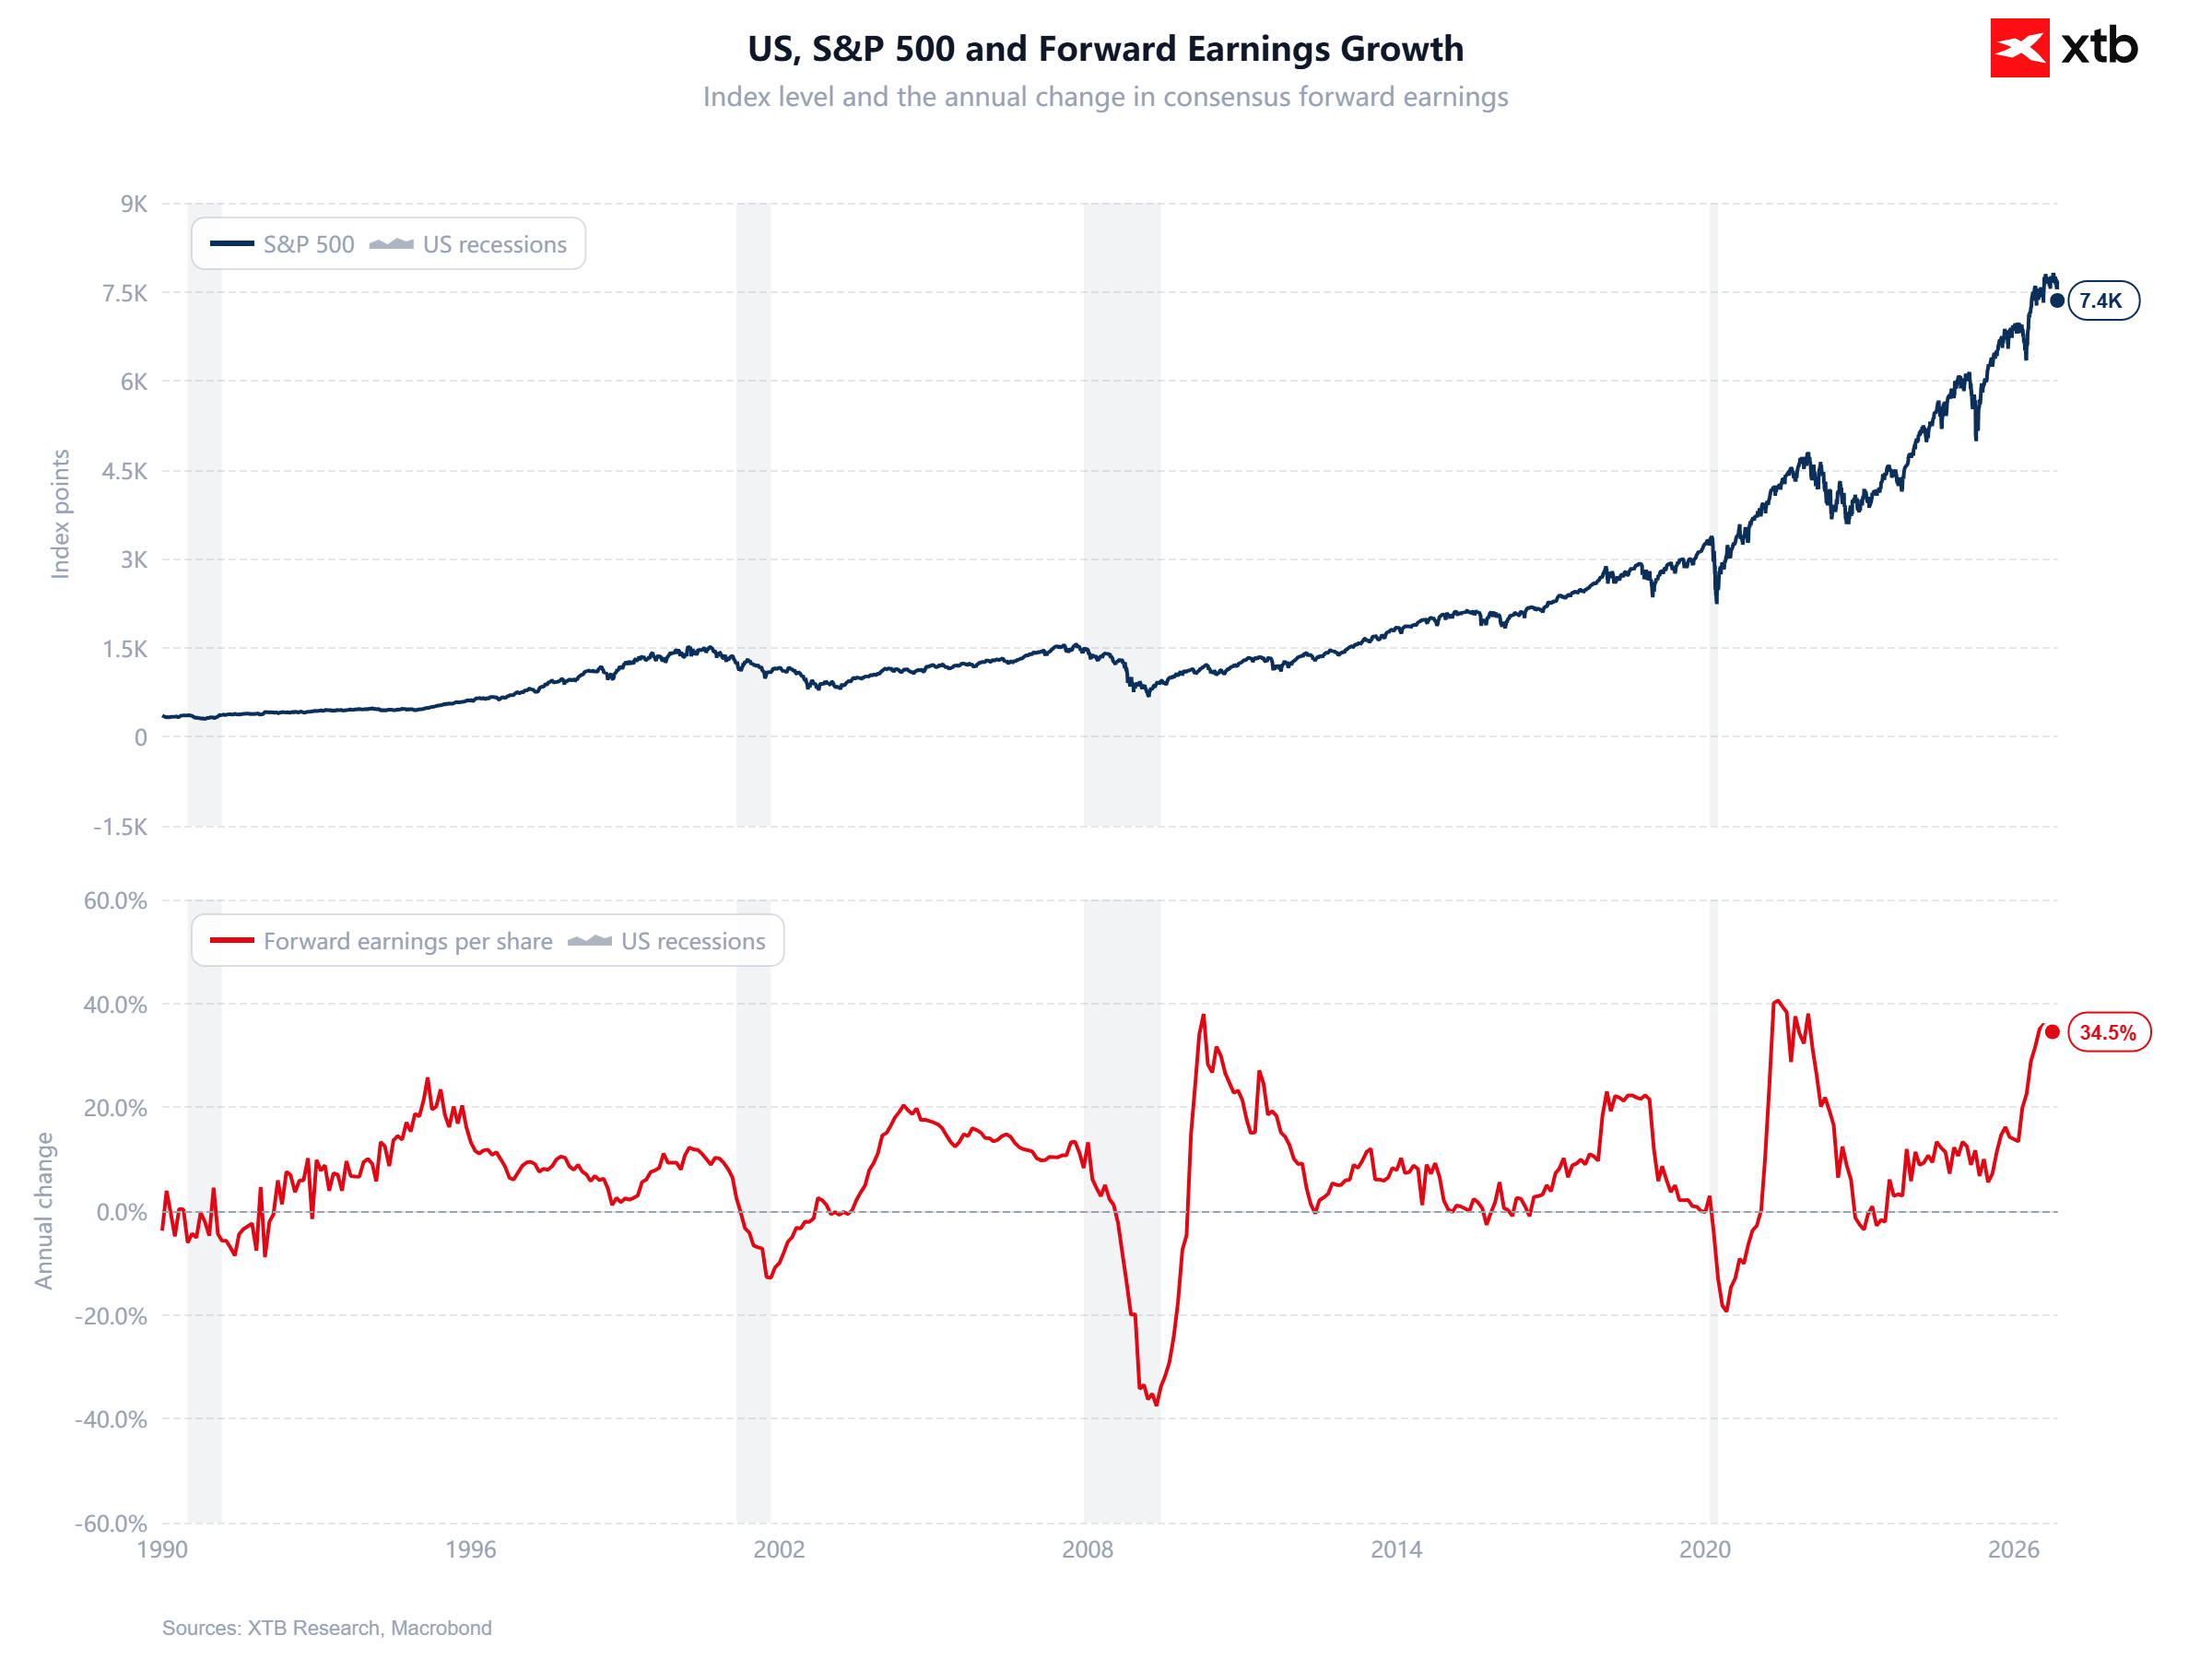
S&P 500 and expected earnings growth (1990–2026)
Expected annual earnings growth for S&P 500 companies has reached 34.5%, approaching some of the highest levels recorded over the past three decades and highlighting exceptionally strong expectations for improving US corporate profitability. Historically, similar accelerations in projected earnings growth have primarily occurred during recoveries from recessions or following periods of sharply declining corporate profitability, whereas the index currently remains near historical highs. Such strong earnings expectations provide fundamental support for elevated equity prices, but they also raise the bar for future financial results and increase the market's sensitivity to negative surprises. The key question for 2027 is therefore whether US companies can translate these optimistic forecasts into actual earnings growth or whether markets will need to adjust their expectations to a slower pace of expansion.
Source: XTB Research
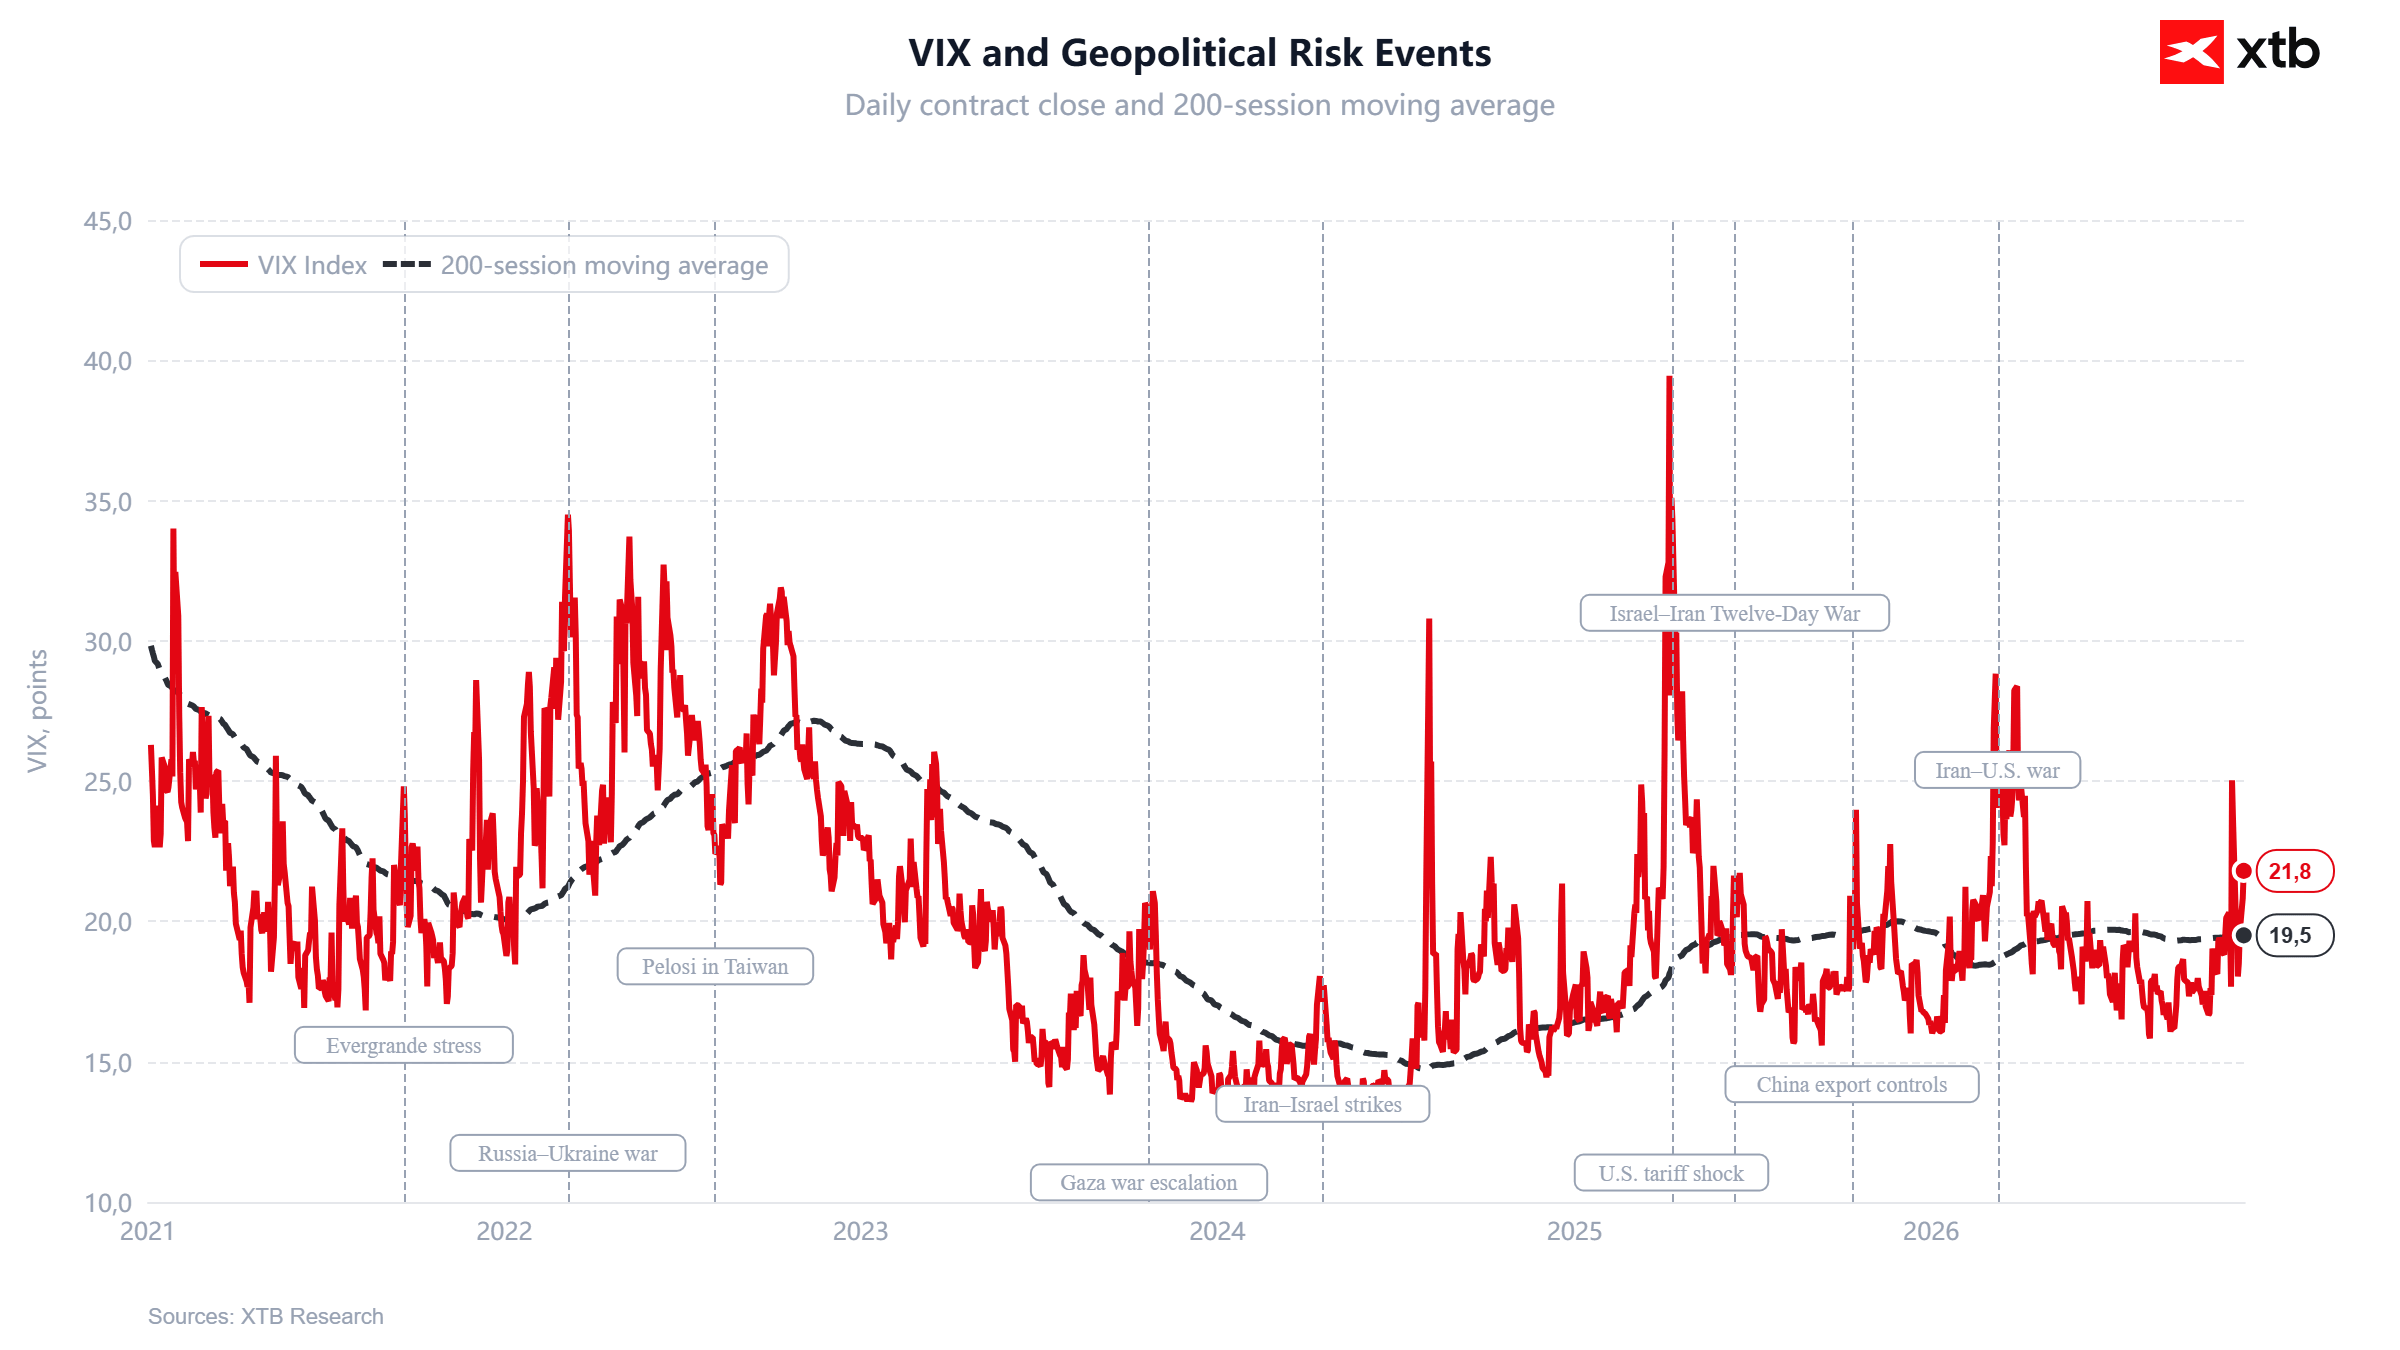
VIX and geopolitical events (2021–2026)
The VIX illustrates how geopolitical events can trigger sharp spikes in market volatility, although their impact on Wall Street often proves temporary unless they lead to a sustained deterioration in the economic outlook. The current VIX reading of 21.8 points remains above its 200-day moving average of 19.5, suggesting elevated risk aversion but still falling well short of the extreme panic observed during previous crises. Historically, the largest volatility spikes have occurred when geopolitical tensions coincided with uncertainty surrounding monetary policy, inflation, and global economic growth. For investors, the crucial factor is therefore not simply whether a conflict occurs, but whether it has the potential to trigger a lasting economic shock and force a reassessment of corporate earnings expectations.
Source: XTB Research


🔼 Oil gains 1.5%


US Open: Wall Street on Edge Ahead of Nvidia Earnings 🚩 Could Rising Oil Prices Weigh on Stocks?


Oil Prices Rise: US Strikes Iran’s Qeshm Island? 🗽 US Retail Sales Beat Forecasts



Market Wrap: Stocks under pressure, Iceye reaches for Avio
The content of this report has been created by XTB S.A., with its registered office in Warsaw, at Prosta 67, 00-838 Warsaw, Poland, (KRS number 0000217580) and supervised by Polish Supervision Authority ( No. DDM-M-4021-57-1/2005). This material is a marketing communication within the meaning of Art. 24 (3) of Directive 2014/65/EU of the European Parliament and of the Council of 15 May 2014 on markets in financial instruments and amending Directive 2002/92/EC and Directive 2011/61/EU (MiFID II). Marketing communication is not an investment recommendation or information recommending or suggesting an investment strategy within the meaning of Regulation (EU) No 596/2014 of the European Parliament and of the Council of 16 April 2014 on market abuse (market abuse regulation) and repealing Directive 2003/6/EC of the European Parliament and of the Council and Commission Directives 2003/124/EC, 2003/125/EC and 2004/72/EC and Commission Delegated Regulation (EU) 2016/958 of 9 March 2016 supplementing Regulation (EU) No 596/2014 of the European Parliament and of the Council with regard to regulatory technical standards for the technical arrangements for objective presentation of investment recommendations or other information recommending or suggesting an investment strategy and for disclosure of particular interests or indications of conflicts of interest or any other advice, including in the area of investment advisory, within the meaning of the Trading in Financial Instruments Act of 29 July 2005 (i.e. Journal of Laws 2019, item 875, as amended). The marketing communication is prepared with the highest diligence, objectivity, presents the facts known to the author on the date of preparation and is devoid of any evaluation elements. The marketing communication is prepared without considering the client’s needs, his individual financial situation and does not present any investment strategy in any way. The marketing communication does not constitute an offer of sale, offering, subscription, invitation to purchase, advertisement or promotion of any financial instruments. XTB S.A. is not liable for any client’s actions or omissions, in particular for the acquisition or disposal of financial instruments, undertaken on the basis of the information contained in this marketing communication. In the event that the marketing communication contains any information about any results regarding the financial instruments indicated therein, these do not constitute any guarantee or forecast regarding the future results.