



Nvidia shares have fallen by around 30% from their recent peak, making this the largest sell-off since early spring 2025, when concerns over a potential US trade war with China and Europe pushed the stock down by more than 40% from its then-record highs. The main drivers behind the latest decline are concerns surrounding Nvidia’s China-related business and recent reports of a potential personal relationship between CEO and co-founder Jensen Huang and an alleged Chinese intelligence operative. These reports may continue to weigh on sentiment toward the stock, although their ultimate impact on Nvidia’s underlying business could prove limited.
It is also difficult to ignore the impression that, had such reports surfaced during a more favourable period for the technology sector, they might have been largely dismissed by the market. The scale of the current reaction and uncertainty surrounding Nvidia, which has resulted in a sharp sell-off and significant underperformance versus the broader technology sector, appears to have more to do with market psychology and concerns over whether the company can preserve its dominant competitive position.
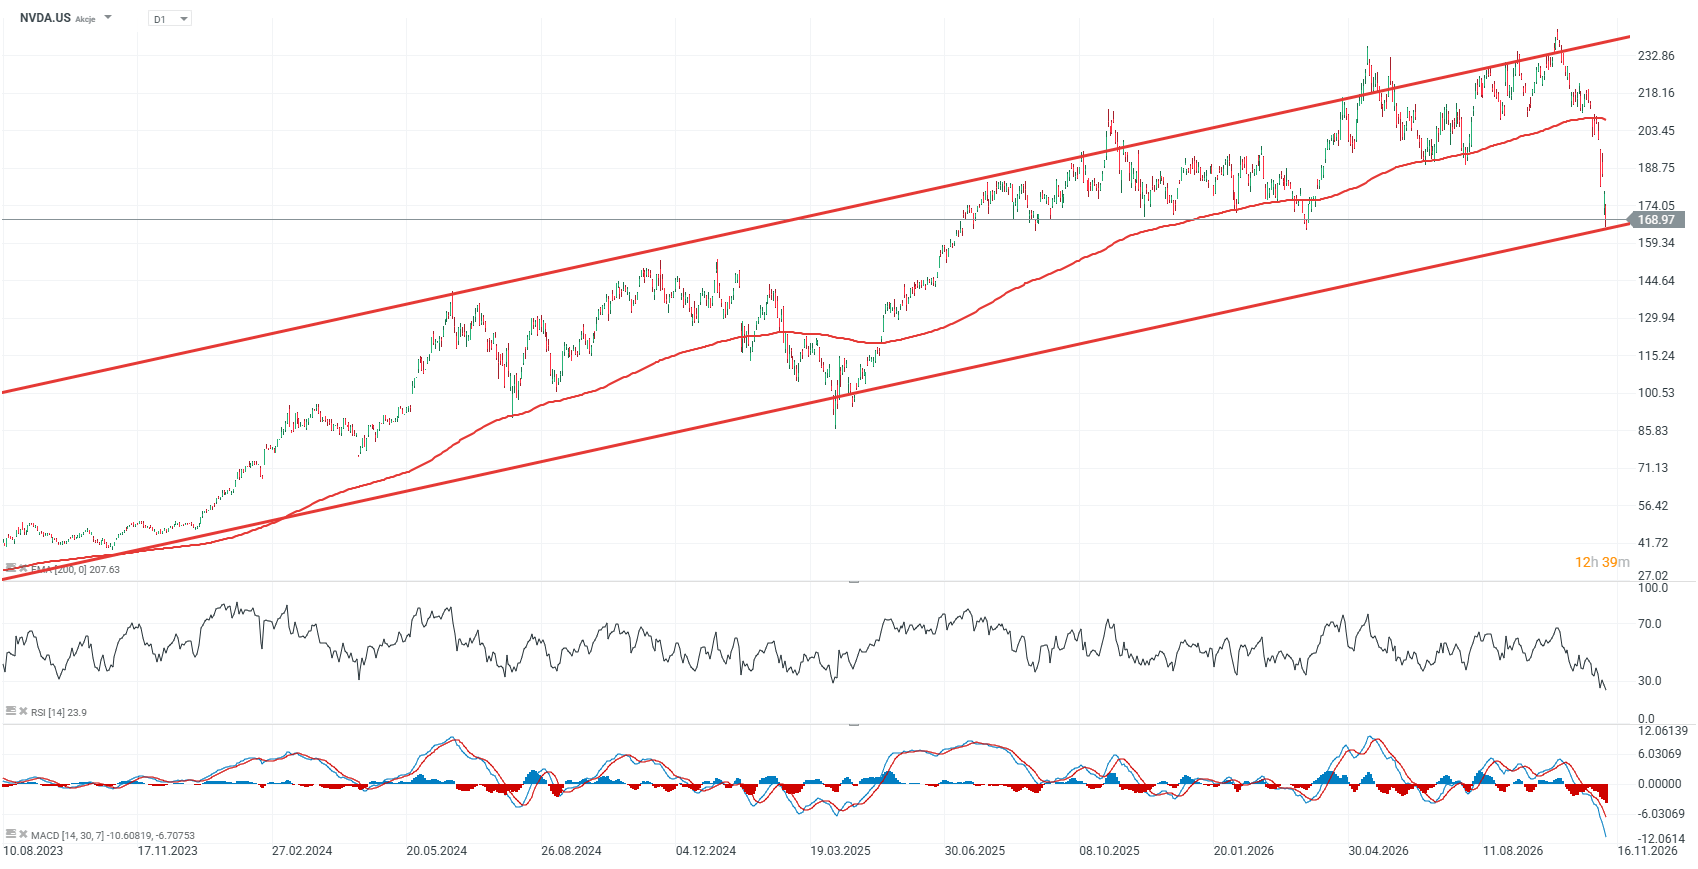
NVDA.US shares (D1 timeframe)
Since 2023, Nvidia shares have experienced only two declines of a similar magnitude. The first occurred in the summer of 2024 and amounted to roughly 30%, after which the stock staged a very strong rebound. The second and largest correction took place between January and April 2025, when the shares fell by almost 44% from their early-year highs. At that time, Nvidia traded as much as 31% below its 200-day exponential moving average, or EMA200 (red line), but remained in a sustained downtrend only briefly.
The current decline from the peak now exceeds 30%, while the shares have dropped around 20% below the 200-day EMA. From a technical perspective, the key issue is whether the stock can recover the USD 190 area, which has previously generated important price reactions, and eventually move back above USD 200, where the EMA200 is currently located. On the downside, the USD 150 area may act as an important support zone, corresponding broadly to the local highs seen around the turn of 2024 and 2025.
Nvidia’s valuation has fallen to around 13.5x expected earnings over the next 12 months, compared with an average of roughly 19x for Nasdaq 100 companies. This points to a substantial discount given the quality of Nvidia’s business and the still very high pace of revenue and earnings growth. If the GPU and AI infrastructure markets remain far from oversupply, Nvidia shares may still have the potential for a strong return to a long-term uptrend.
 Source: XTB
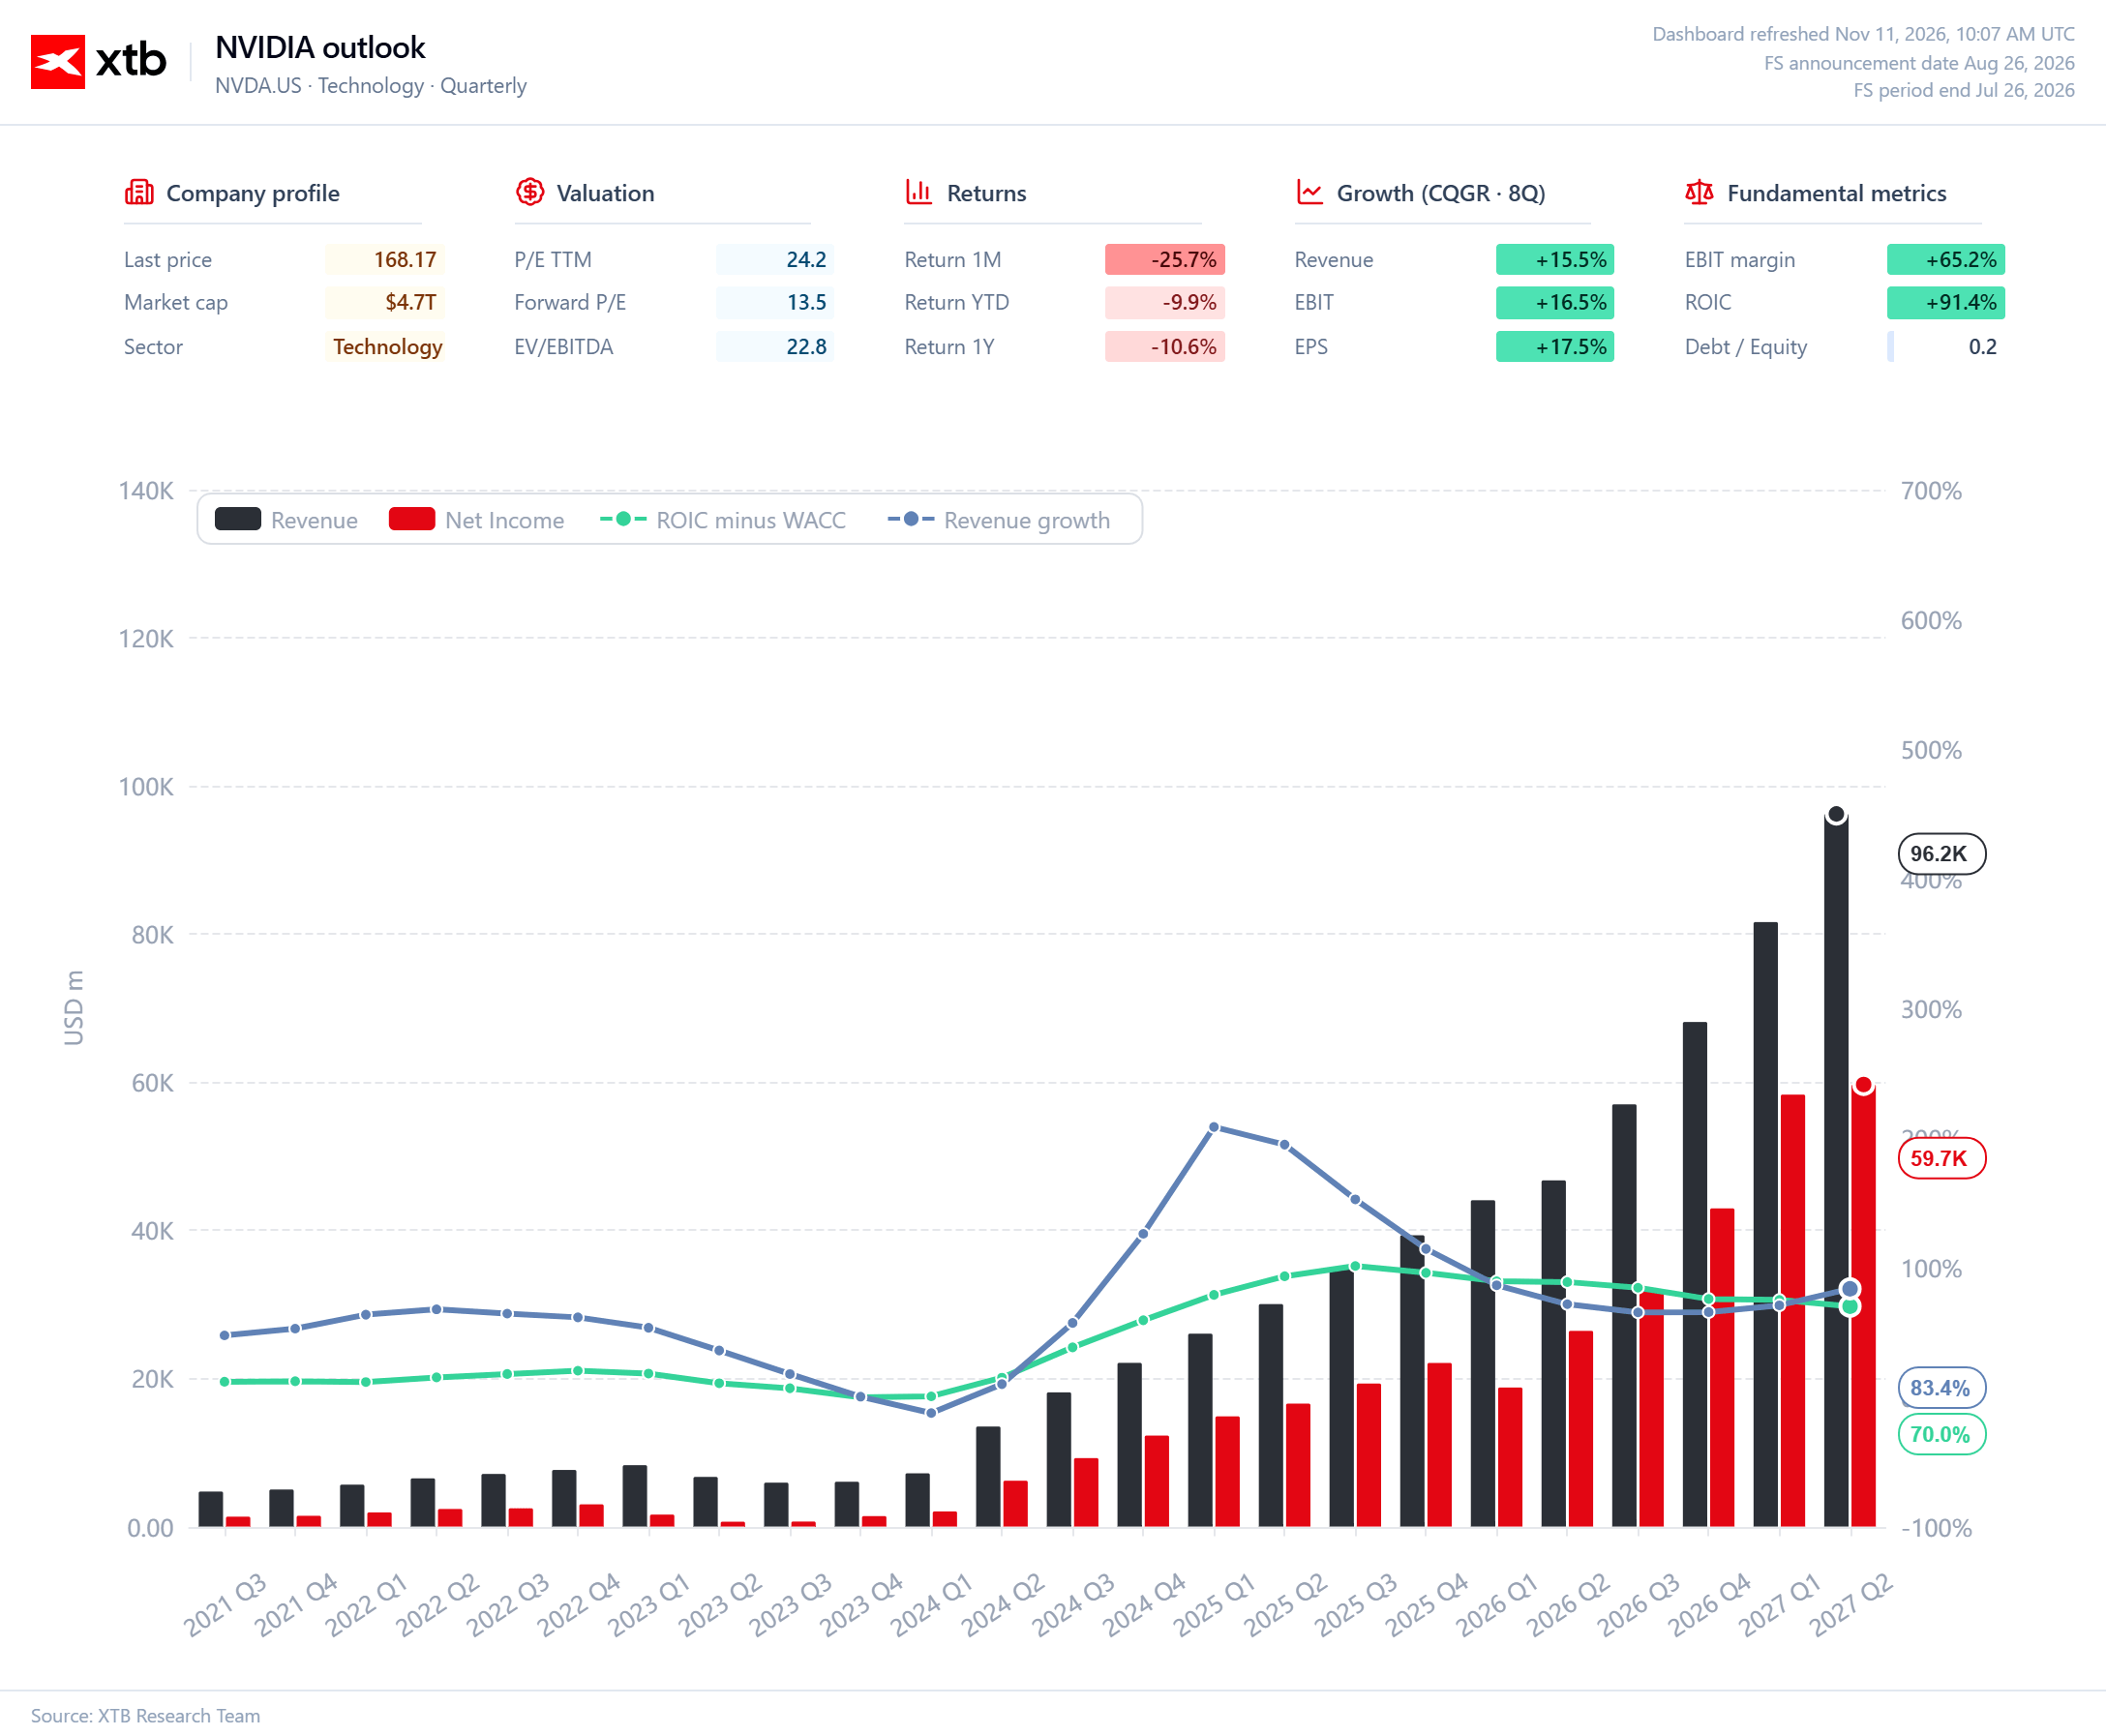
Revenue, net income and the spread over the cost of capital
The third chart best illustrates the scale of Nvidia’s transformation from a graphics-chip producer into one of the most profitable technology businesses in the world. Quarterly revenue has increased from just a few billion dollars in 2021 to a projected roughly USD 96 billion in Q2 2027, while net income could approach USD 60 billion. More importantly, profits are growing faster than revenue, highlighting the extraordinary operating leverage generated by the high margins of Nvidia’s AI platform and the enormous scale of its Data Center business. At the same time, the so-called EVA spread, defined here as the difference between return on invested capital (ROIC) and the weighted average cost of capital (WACC), remains close to 70 percentage points, indicating that Nvidia continues to create substantial economic value from each additional dollar reinvested into the business.
This metric is fundamentally more important than revenue growth alone: growth creates shareholder value only when the return generated on incremental investment remains above the cost of capital. Revenue growth is clearly normalising compared with the explosive expansion seen in 2024–2025, but according to the forecasts shown it still remains exceptionally high, at more than 80%. The key risk is therefore not a lack of growth, but rather the possibility of gradual margin and ROIC compression as competition from AMD and custom ASICs increases, hyperscalers gain greater bargaining power and the cost of developing successive platform generations rises. Nvidia’s fundamentals remain exceptionally strong, but at this scale, future shareholder returns will increasingly depend on the company’s ability to sustain its economic moat rather than simply on continued rapid growth in the AI market.
 Source: XTB Research
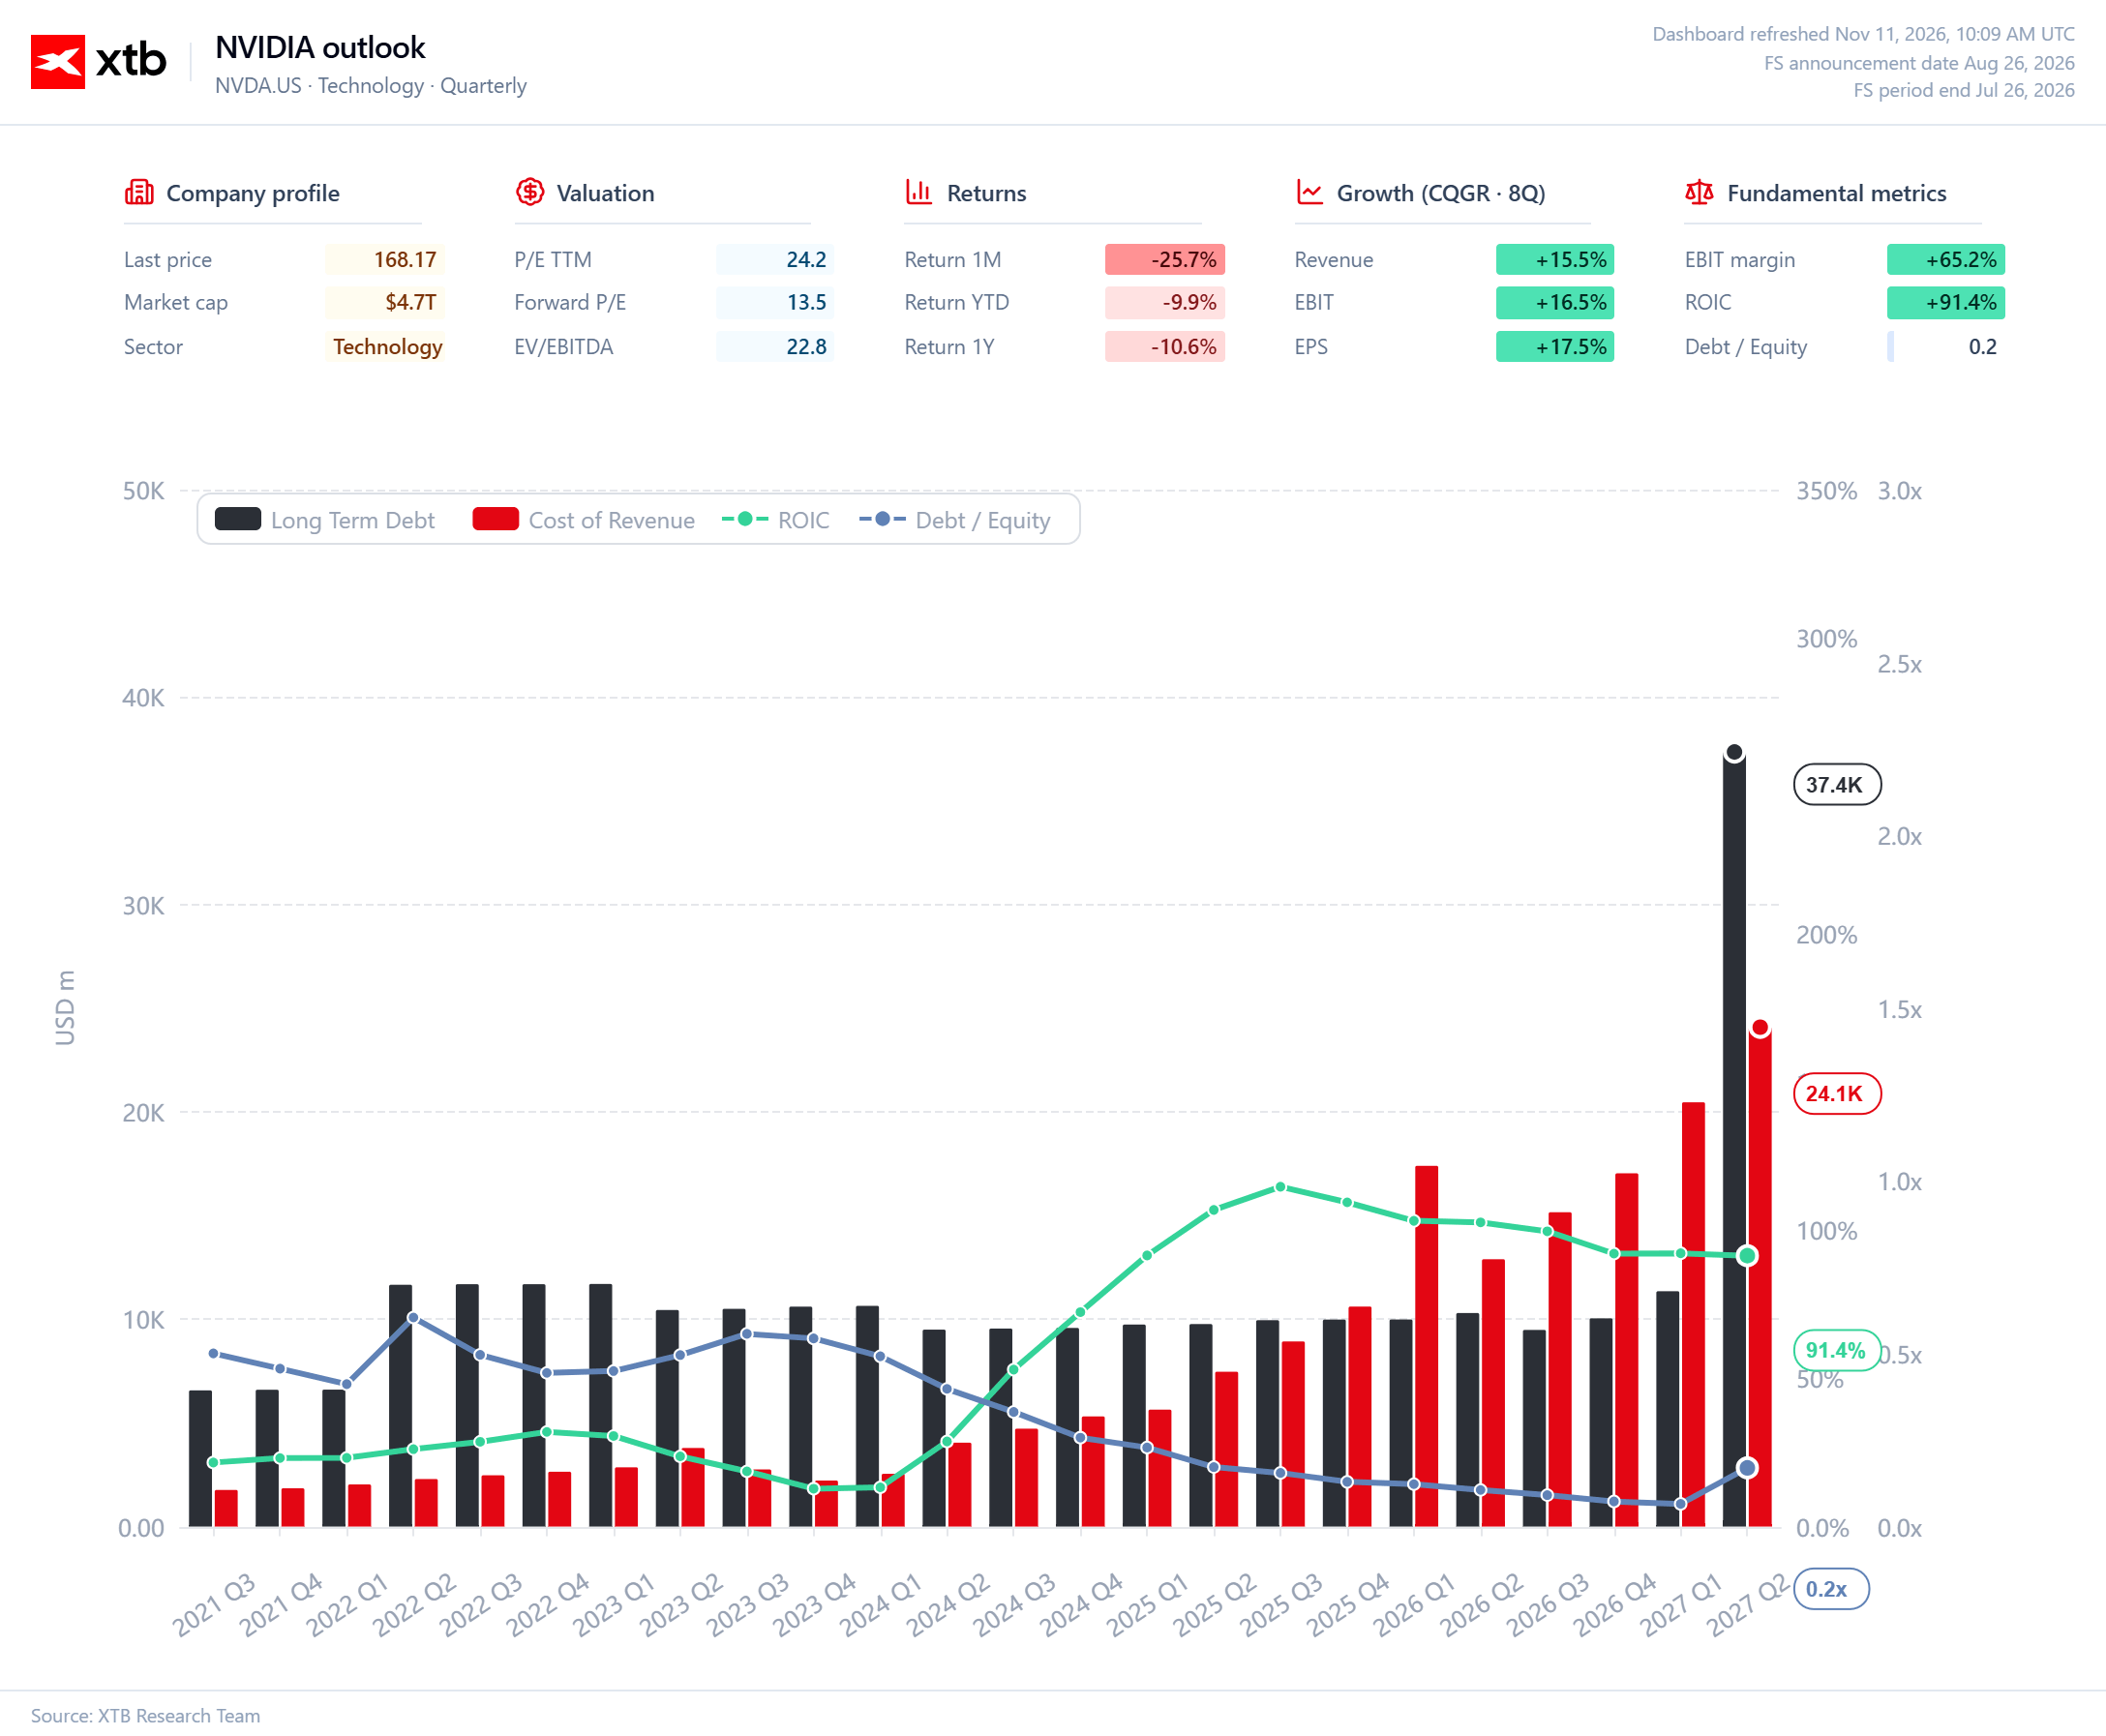
Balance sheet, ROIC and valuation
The first chart clearly shows that Nvidia remains a business with exceptional capital efficiency, even as it enters a phase of much greater operational and financial scale. ROIC remains close to 91%, indicating that the company continues to generate an exceptionally high return on the capital employed in the business despite the rapid expansion in revenue and operating costs. At the same time, debt-to-equity remains very low at around 0.2x, meaning Nvidia’s growth is not being financed through aggressive leverage but predominantly through its own cash-generating capacity.
The projected increase in long-term debt to around USD 37 billion should therefore be viewed primarily in the context of the company’s expanding scale rather than as a sign of deteriorating balance-sheet quality. The valuation has also become considerably more interesting: trailing P/E stands at around 24.2x, while forward P/E falls to just 13.5x, highlighting the scale of earnings growth currently embedded in consensus estimates. EV/EBITDA of around 22.8x remains relatively high in absolute terms, but given Nvidia’s current ROIC and earnings growth profile, it no longer implies the kind of extreme premium seen during earlier stages of the AI boom. The key question for investors is therefore no longer simply whether Nvidia looks expensive relative to the broader market, but whether it can sustain its extraordinary returns on capital long enough for the earnings expectations embedded in the forward multiple to materialise.
 Source: XTB Research
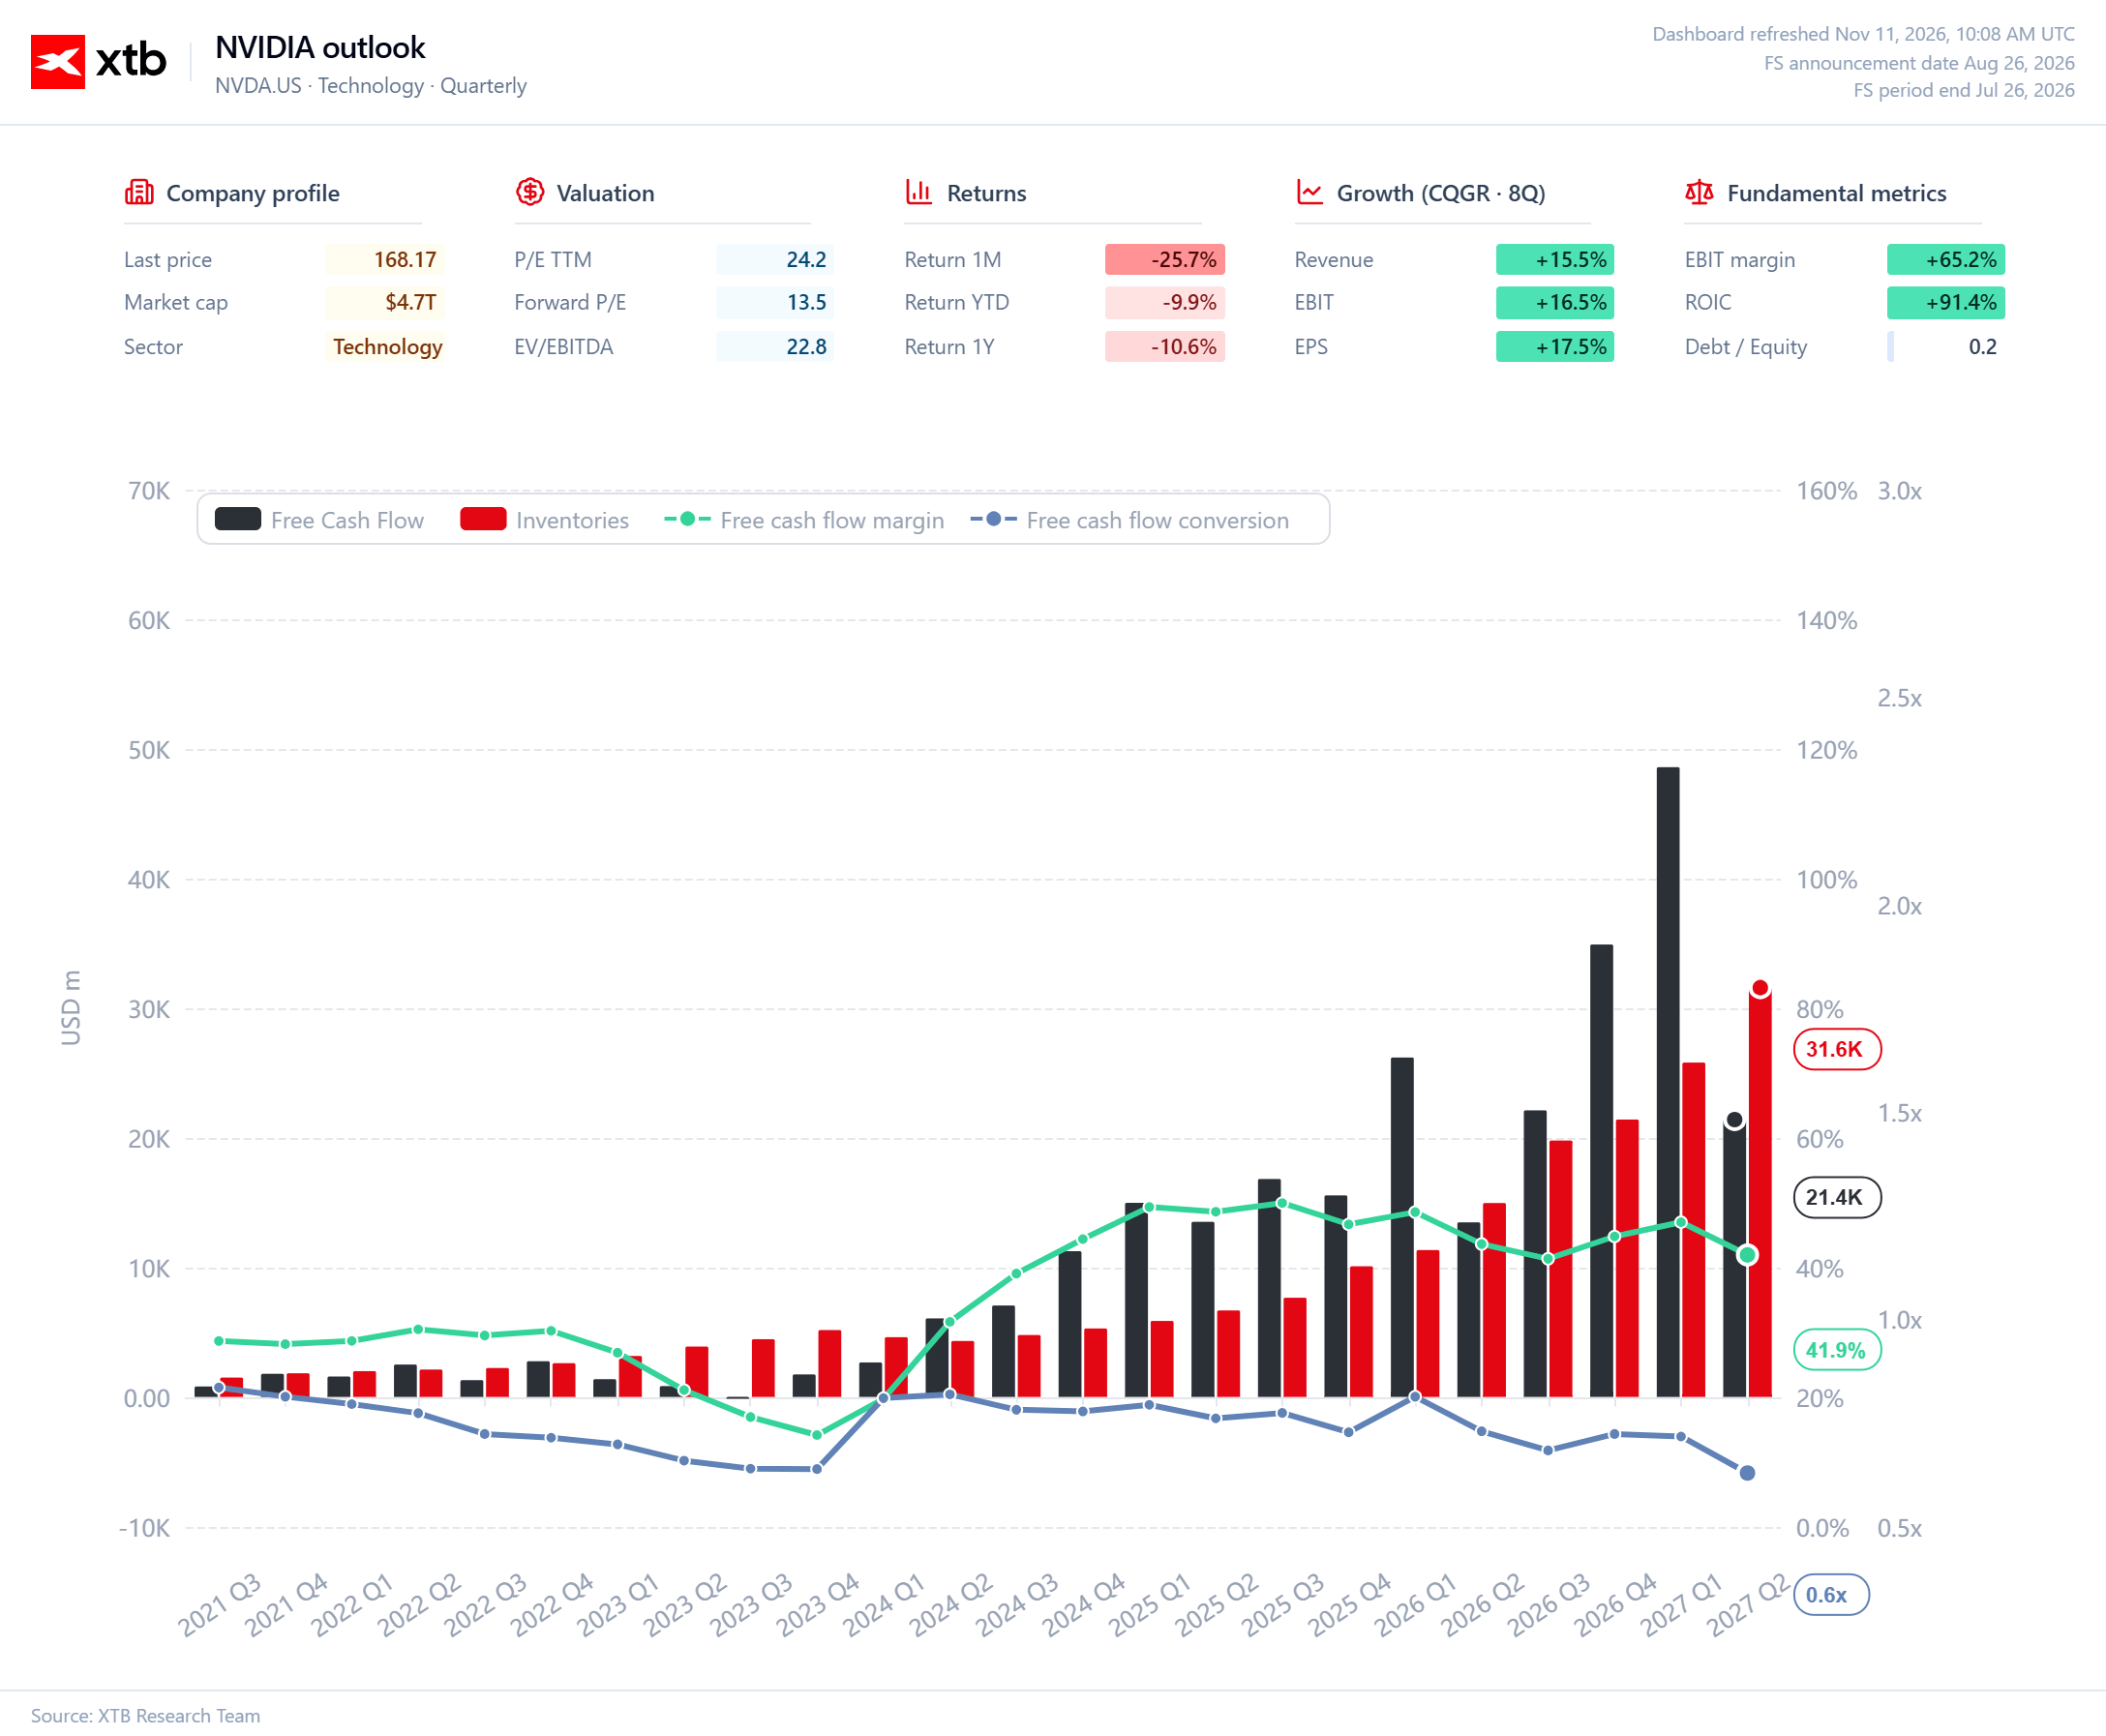
Free cash flow, inventories and cash conversion
The second chart highlights an important shift in Nvidia’s economics: the business is generating enormous amounts of free cash flow, but at the same time more capital is being tied up to support future growth. Free cash flow has increased several-fold in recent years and exceeded USD 30–40 billion in the strongest quarters, confirming the company’s exceptional ability to monetise demand for AI accelerators. At the same time, inventories are rising much faster than during the previous stage of the cycle and, according to the forecasts shown, could exceed USD 30 billion. This mainly reflects Nvidia’s larger production scale and the need to secure components and manufacturing capacity well in advance.
This should not automatically be interpreted as a sign of weakening demand, but inventory growth should be monitored relative to revenue because this is often one of the first areas where a semiconductor cycle begins to deteriorate. The free cash flow margin remains very high at around 42%, showing that Nvidia continues to convert a substantial share of revenue into cash even as working-capital requirements increase. A somewhat more cautious signal comes from the decline in the FCF conversion ratio to around 0.6x, suggesting that cash-flow growth is beginning to lag behind reported accounting earnings. As long as higher inventories translate into continued strong sales of Blackwell, Rubin and broader AI infrastructure, this can be viewed as a cost of growth; however, if inventories were to rise faster than revenue for several consecutive quarters, it would become one of the first fundamental warning signals.
 Source: XTB Research


Economic calendar: European earnings season in focus amid light macro calendar (11.11.2026)


US OPEN: Higher CPI Inflation Cools Sentiment, Anthropic Targets $1.4 Trillion Valuation


Anthropic Debut Price. Does One Trillion Dollars Sound Reasonable?


What’s Next for the S&P 500? 🔼 U.S. Earnings Season Recap
The content of this report has been created by XTB S.A., with its registered office in Warsaw, at Prosta 67, 00-838 Warsaw, Poland, (KRS number 0000217580) and supervised by Polish Supervision Authority ( No. DDM-M-4021-57-1/2005). This material is a marketing communication within the meaning of Art. 24 (3) of Directive 2014/65/EU of the European Parliament and of the Council of 15 May 2014 on markets in financial instruments and amending Directive 2002/92/EC and Directive 2011/61/EU (MiFID II). Marketing communication is not an investment recommendation or information recommending or suggesting an investment strategy within the meaning of Regulation (EU) No 596/2014 of the European Parliament and of the Council of 16 April 2014 on market abuse (market abuse regulation) and repealing Directive 2003/6/EC of the European Parliament and of the Council and Commission Directives 2003/124/EC, 2003/125/EC and 2004/72/EC and Commission Delegated Regulation (EU) 2016/958 of 9 March 2016 supplementing Regulation (EU) No 596/2014 of the European Parliament and of the Council with regard to regulatory technical standards for the technical arrangements for objective presentation of investment recommendations or other information recommending or suggesting an investment strategy and for disclosure of particular interests or indications of conflicts of interest or any other advice, including in the area of investment advisory, within the meaning of the Trading in Financial Instruments Act of 29 July 2005 (i.e. Journal of Laws 2019, item 875, as amended). The marketing communication is prepared with the highest diligence, objectivity, presents the facts known to the author on the date of preparation and is devoid of any evaluation elements. The marketing communication is prepared without considering the client’s needs, his individual financial situation and does not present any investment strategy in any way. The marketing communication does not constitute an offer of sale, offering, subscription, invitation to purchase, advertisement or promotion of any financial instruments. XTB S.A. is not liable for any client’s actions or omissions, in particular for the acquisition or disposal of financial instruments, undertaken on the basis of the information contained in this marketing communication. In the event that the marketing communication contains any information about any results regarding the financial instruments indicated therein, these do not constitute any guarantee or forecast regarding the future results.