


- Platinum trades at 1700 USD per ounce following a sharp pullback from its January peak of nearly3 000 USD.
- The World Platinum Investment Council forecasts a 2026 surplus of 265 000 ounces driven largely by ETF outflows.
- South African mining production remains constrained by aging infrastructure and structural underinvestment.
- Softer US inflation data reduces expectations for further Federal Reserve rate hikes and supports precious metal prices.
- Technical indicators remain bearish while the price tests the key 1700 USD support zone.

- Platinum trades at 1700 USD per ounce following a sharp pullback from its January peak of nearly3 000 USD.
- The World Platinum Investment Council forecasts a 2026 surplus of 265 000 ounces driven largely by ETF outflows.
- South African mining production remains constrained by aging infrastructure and structural underinvestment.
- Softer US inflation data reduces expectations for further Federal Reserve rate hikes and supports precious metal prices.
- Technical indicators remain bearish while the price tests the key 1700 USD support zone.
Platinum is priced at $1,699 per ounce, although during the January rally it came very close to $3,000, surpassing previous historic highs. Platinum is currently losing over 3% week-on-week, 2.5% month-on-month, and 20.5% year-to-date, although on a twelve-month horizon it is still up about 8.5%. It is about 42% away from January's record of $2,923.70. This comparison captures the nature of this market well: a sharp surge at the beginning of the year, followed by an equally sharp giveback of gains. This shows that earlier moves were mainly driven by speculation and hope for changing fundamentals, which are ultimately turning against the metal at this moment.
The most important fundamental change is the balance sheet revision. The World Platinum Investment Council forecasts a surplus of 265 thousand ounces for 2026, compared to a deficit of 297 thousand ounces projected just a quarter earlier. A shift of over 560 thousand ounces in three months is significant for a market of this size. This would mark the first annual surplus since 2022, following three years of deficits.
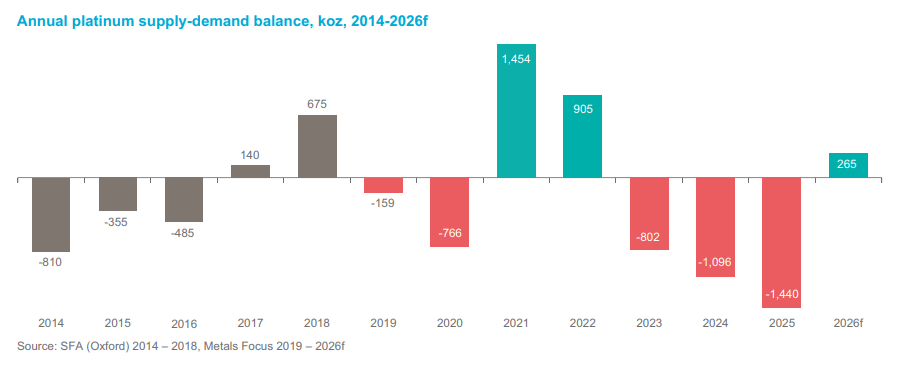
What actually changed?
Contrary to intuition, it is not about supply. Mining production is expected to remain virtually flat at 5,551 thousand ounces compared to 5,561 thousand ounces a year earlier. Recycling grows by 8%, giving total supply higher by 2%. That is minor.
The entire change lies on the demand side, which is expected to fall by 18%. This consists of three components with very distinct characteristics.
- Investments reversed completely by 180 degrees. From an inflow of 1.15 million ounces in 2025 to an outflow of 83 thousand ounces in 2026. ETFs alone are projected to lose 389 thousand ounces after gaining 200 thousand ounces the previous year. This is the main driver of the revision and simultaneously its weakest point as a forecast, as discussed below.
- Jewelry declines by 15% to 1,883 thousand ounces, with China dropping 32% year-on-year in the second quarter. A classic reaction to high prices.
- Automotive falls by 4% to 2,904 thousand ounces. Slower-than-expected EV adoption paradoxically aids catalyst demand in the short term, but the structural trend remains unchanged.
- The only growing category is industrial: up 5% to 2,385 thousand ounces. Glass rebounds by 23%, electricals by 19%, and fuel cells by 8%.
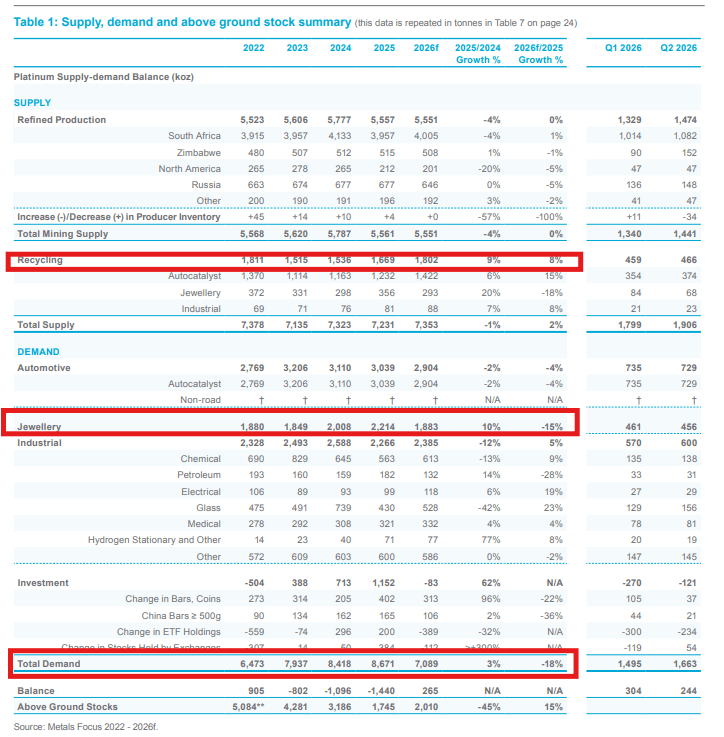 Demand in 2026 is expected to decline by nearly 1/5. Source: WPIC
Is this surplus less dangerous than it looks?
This brings us to a detail easily overlooked in headline numbers. WPIC itself notes in its latest report that the market could actually return to a deficit in the second half of the year, as selling pressure from ETFs has run its course. In other words, the entire surplus occurred in the first half and is an artifact of a one-off liquidation of paper positions rather than a lasting physical imbalance. The clear rebound in the glass sector is notable, though historically such recoveries have often been one-offs.
One point is worth highlighting. Metal sold by a fund does not disappear; it returns to the market and increases available supply at that moment. However, that same ounce can return to the fund when sentiment turns. A surplus driven by ETF outflows is by definition reversible in a way that a surplus from a new mine is not.
This is supported by above-ground stock levels. Following three years of deficits, they have fallen to around 2,010 thousand ounces, corresponding to roughly fourteen weeks of demand. Even after accounting for this year's surplus, the buffer remains thin.
On the structural supply side, nothing is improving. South Africa accounts for about 72% of global mining output, and its production is 26% lower than its peak of 5.3 million ounces in 2006. The reasons are well-known and hard to reverse: aging mines, rising costs, and years of underinvestment. New supply exists but is distant. The Karo project in Zimbabwe, for which Tharisa secured $294 million, will only launch in Q4 2027 with 226 thousand ounces in phase one.
The real problem is interest rates
The physical balance is important, but secondary right now. Price is dictated by opportunity cost.
The 10-year US Treasury yield stands at 5.24%, near its highest levels since 2007. The Fed raised rates in September for the first time in three years, and the market was pricing in a 68% chance of another hike in October and 95% in December. For a non-yielding asset, this is a punitive environment.
However, today's August PCE inflation data came in noticeably below expectations: core inflation at 3.0% versus 3.3% expected, and 0.2% monthly versus 0.3%. The probability of an October rate hike dropped from 64% to 34% within a week, the US dollar weakened, yields fell by 4 to 5 basis points, and gold received support. This is directly positive for platinum and implies that valuation built on a 95% chance of a December hike needs reassessment.
Concurrently, falling oil prices following improved flows through the Strait of Hormuz take off some inflationary pressure, acting in the same direction.
It is worth remembering that if the market moves away from monetary policy concerns and focuses on US fiscal issues—which could push gold back above $5,000—platinum could react positively to such developments as well.
Valuations and positioning
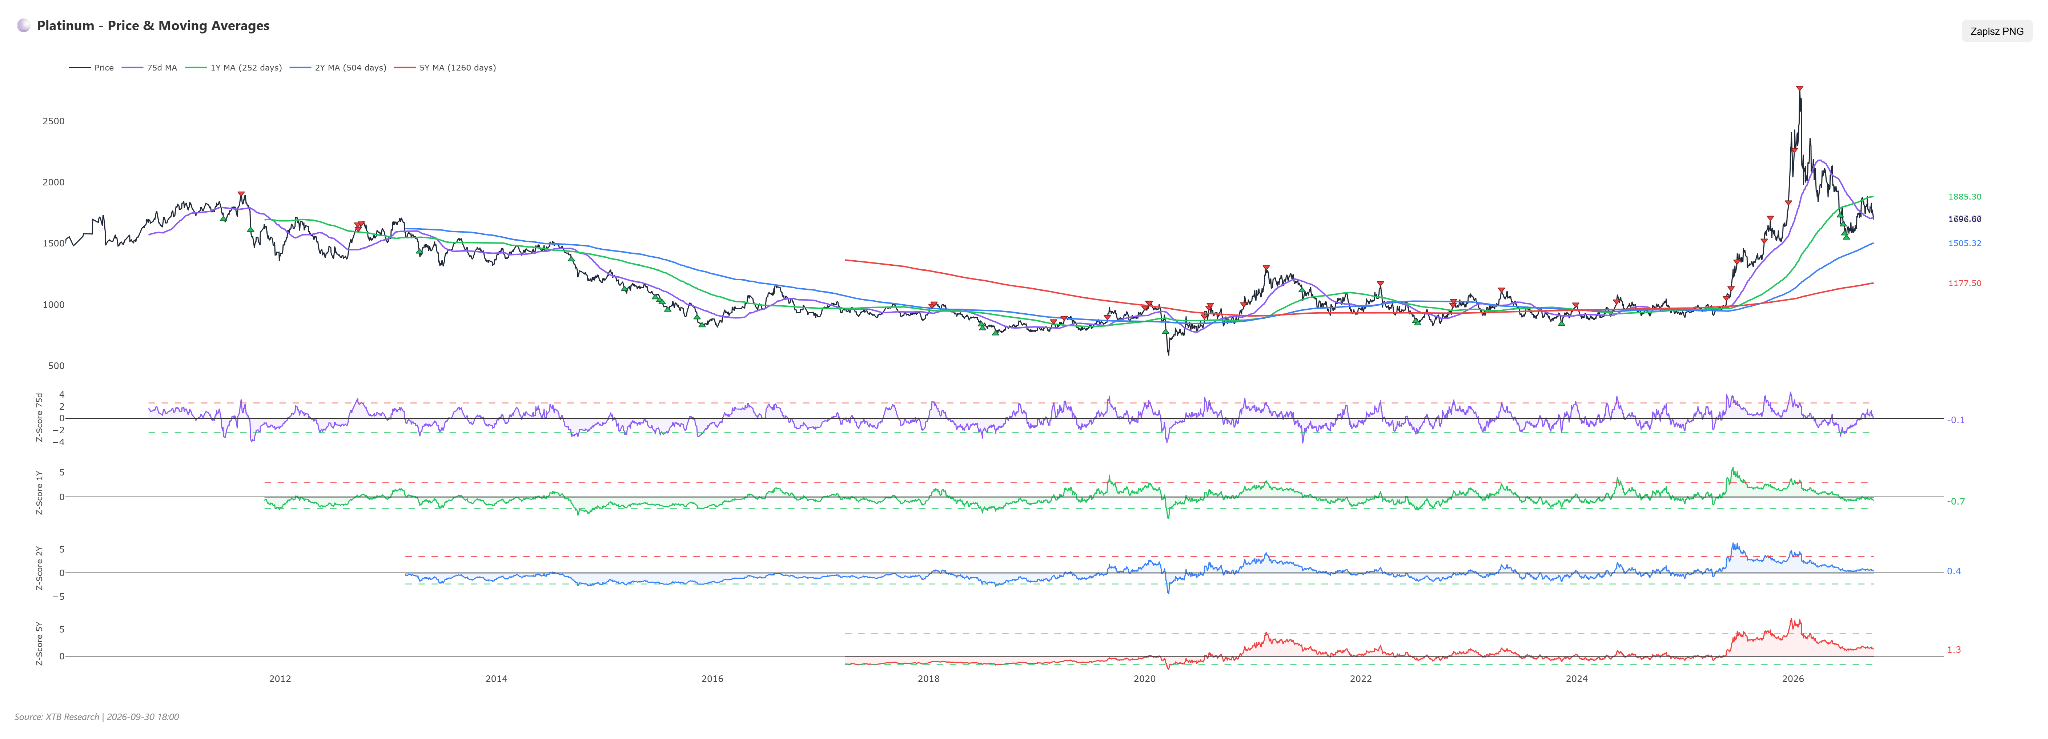
The 1-year Z-score stands at -0.72, 2-year at +0.42, and 5-year at +1.32. Short-term, platinum is cheap relative to its history; over a longer window, it remains above average. The 5-year indicator shows a systematic premium reduction: 2.36 six months ago, 1.09 a quarter ago, a rebound to 1.63 a month ago, and now 1.32.
Speculative positioning according to CFTC data as of September 22 shows a net long position of 15,366 contracts, a Z-score of -0.37, and the 64.4th percentile of historical distribution. The share of long positions in the speculative portfolio is 69.9%, with a weekly change of just +146 contracts.
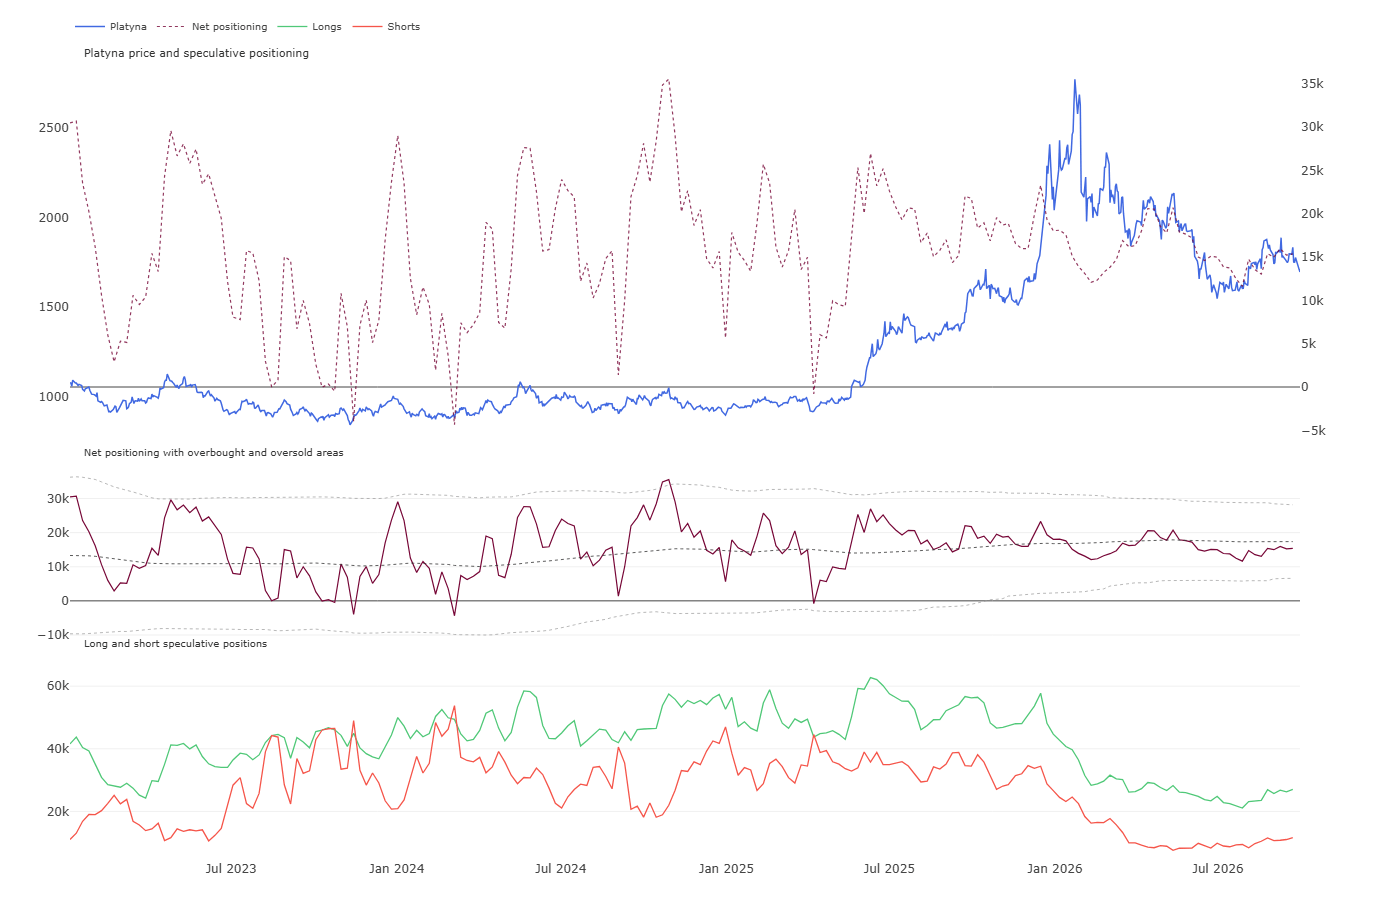
This combination reveals something clear. Funds are neither overcrowded on the long side nor aggressively building short positions. They are simply sitting on the sidelines. On one hand, this limits the risk of a cascade liquidation, as there is little to liquidate on a large scale. On the other hand, there is no fuel for a short squeeze to drive a rapid recovery.
Technical picture
RSI at 37 points is approaching oversold territory but has not reached it and is not generating a reversal signal. MACD and moving average alignments remain bearish. The price sits 3.13% below its 50-day moving average.
The daily chart adds key context. The current level of 1,700 is not just a round number; it represents a consolidation zone from November and December 2025 before the surge toward January's record. Price has returned to the exact starting point of that move. Such levels rarely break on the first attempt, but losing them would be significant, as there is no support structure from the past year below until the 1,550 region.
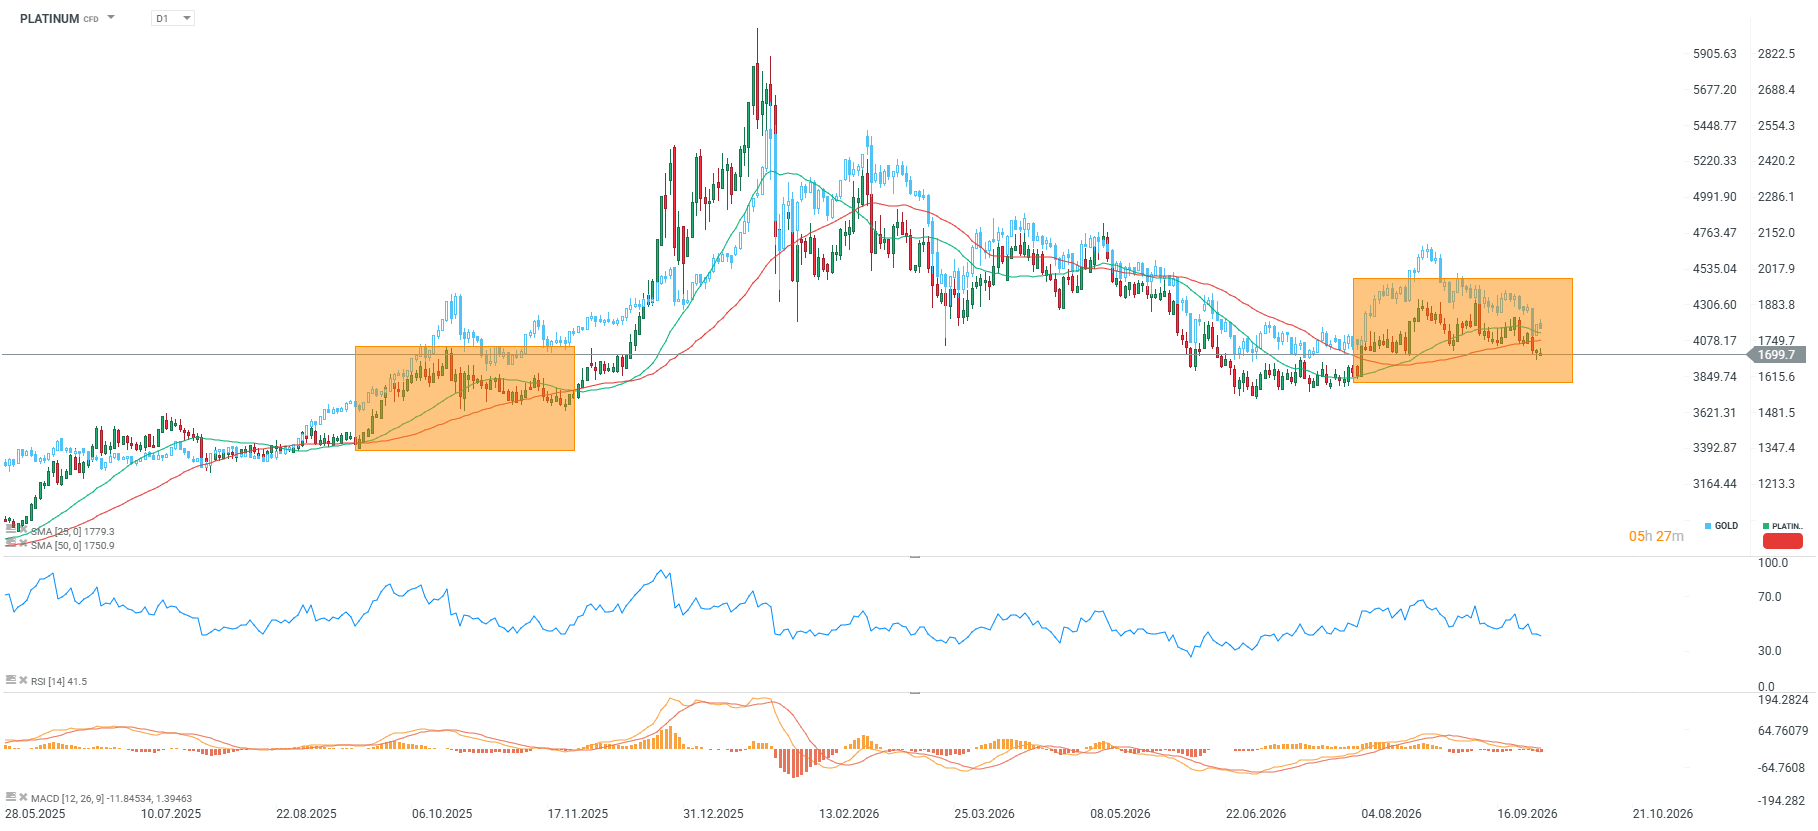
The structure since the June low unfolds as follows: the market set a low near 1,530, bounced to 1,930 in August, and subsequently formed a sequence of lower highs (around 1,930, then 1,910), currently testing the bottom of this range. This is a textbook distribution pattern, and until broken to the upside, the advantage lies with the supply side.
Bearish scenario, currently favored. 10-year yields remaining near 5.24% or higher, combined with the materialization of the forecasted surplus, pushes prices below 1,660 and further toward 1,620. This is supported by MACD, moving average setups, and the sequence of lower highs since August.
Bullish scenario. Requires a sustained break above 1,700 with a daily close, ideally driven by further dovish Fed expectations and yields dropping below 5.00%. Reclaiming the 50-day moving average opens the door to 1,750, while breaking 1,820 would invalidate the August-September downtrend sequence.
Conclusions
Platinum sits in an unusual spot: physical fundamentals are noticeably better than headline surplus figures suggest—driven largely by paper outflows that have halted—alongside structural supply constraints in South Africa and thin stocks. However, interest rates and a strong dollar weigh heavily on price.
This second headwind is starting to soften. If softer US inflation data holds and the Fed skips a December rate hike, platinum holds a solid fundamental basis for a recovery from a technical support level. Pending confirmation, the short-term technical outlook remains bearish.


Netflix results: An advertising setback



Daily Summary: Buyers Refuse to Give In

US Natural gas extends declines 🔥📉



US OPEN: The wave of AI concerns is building again, oil returns near highs
The content of this report has been created by XTB S.A., with its registered office in Warsaw, at Prosta 67, 00-838 Warsaw, Poland, (KRS number 0000217580) and supervised by Polish Supervision Authority ( No. DDM-M-4021-57-1/2005). This material is a marketing communication within the meaning of Art. 24 (3) of Directive 2014/65/EU of the European Parliament and of the Council of 15 May 2014 on markets in financial instruments and amending Directive 2002/92/EC and Directive 2011/61/EU (MiFID II). Marketing communication is not an investment recommendation or information recommending or suggesting an investment strategy within the meaning of Regulation (EU) No 596/2014 of the European Parliament and of the Council of 16 April 2014 on market abuse (market abuse regulation) and repealing Directive 2003/6/EC of the European Parliament and of the Council and Commission Directives 2003/124/EC, 2003/125/EC and 2004/72/EC and Commission Delegated Regulation (EU) 2016/958 of 9 March 2016 supplementing Regulation (EU) No 596/2014 of the European Parliament and of the Council with regard to regulatory technical standards for the technical arrangements for objective presentation of investment recommendations or other information recommending or suggesting an investment strategy and for disclosure of particular interests or indications of conflicts of interest or any other advice, including in the area of investment advisory, within the meaning of the Trading in Financial Instruments Act of 29 July 2005 (i.e. Journal of Laws 2019, item 875, as amended). The marketing communication is prepared with the highest diligence, objectivity, presents the facts known to the author on the date of preparation and is devoid of any evaluation elements. The marketing communication is prepared without considering the client’s needs, his individual financial situation and does not present any investment strategy in any way. The marketing communication does not constitute an offer of sale, offering, subscription, invitation to purchase, advertisement or promotion of any financial instruments. XTB S.A. is not liable for any client’s actions or omissions, in particular for the acquisition or disposal of financial instruments, undertaken on the basis of the information contained in this marketing communication. In the event that the marketing communication contains any information about any results regarding the financial instruments indicated therein, these do not constitute any guarantee or forecast regarding the future results.