



Precious metals continue to rebound. Silver is up nearly 4%, while gold continues to advance, reaching its highest level since late June. Over the past three trading sessions, gold has climbed by almost $200, approaching $4,300 per ounce. The rally has been supported by weaker US labour market data, the relative weakness of the US dollar, and growing expectations of an agreement to reopen the Strait of Hormuz, potentially leading to a de-escalation of tensions in the Middle East. Despite the strong recovery in sentiment, both silver and gold remain well below the record highs reached earlier this year.
Oil prices have fallen nearly 5% this week, providing an additional tailwind for silver. However, the prospect of a lasting agreement on reopening the Strait of Hormuz remains uncertain. Investors are now awaiting the release of the US July Nonfarm Payrolls (NFP) report at 1:30 PM GMT. The report is expected to provide important clues regarding the future path of US interest rates and could trigger elevated volatility in both gold and silver. A weaker-than-expected NFP reading would likely support precious metals, while stronger-than-expected data (the market expects payroll growth of 80,000 following 57,000 in June) could prompt short-term profit-taking after the sharp rally seen in recent days.
- The weaker-than-expected July ADP employment report reduced expectations of a Federal Reserve rate hike in September, supporting precious metals, although the overall US economic backdrop remains solid.
- The global economy continues to expand at around 3% year-over-year and remains far from recession, providing support for silver, which also benefits from its growing role in AI-related data centre infrastructure.
- The US Dollar Index (DXY) is edging higher today but remains close to six-week lows around 99.8 after its sharp decline since July 25, continuing to enhance the relative attractiveness of precious metals.
- Additional support comes from reports of progress in talks between Iran and Oman regarding the reopening of the Strait of Hormuz, although the broader geopolitical situation in the Middle East remains highly unstable.
SILVER and GOLD chart (D1 timeframe)
Silver has already rebounded by around 20% from its recent local lows and is currently testing a key resistance level represented by the 50-day exponential moving average (EMA50, orange line). A break above this level would mark the first move above the EMA50 since May. The next major resistance zone lies between $68 and $71 per ounce, where the 200-day EMA (red line) converges with the 23.6% Fibonacci retracement of the January-February decline. On the downside, $58 per ounce remains the key support level.
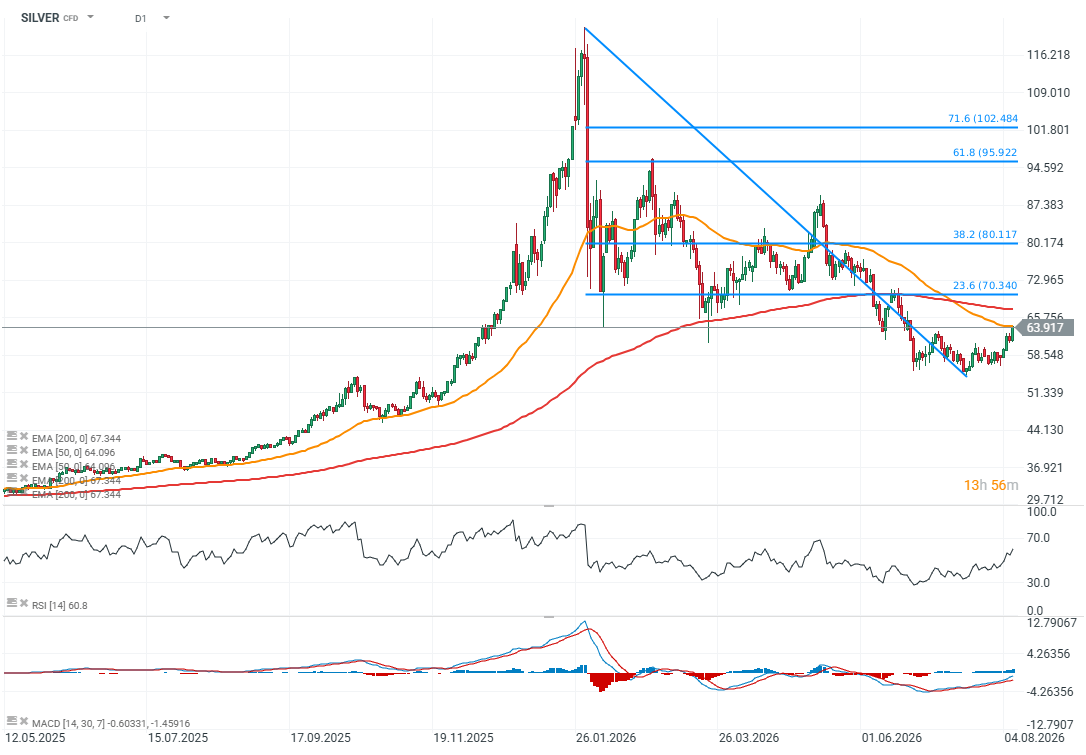
Source: xStation5
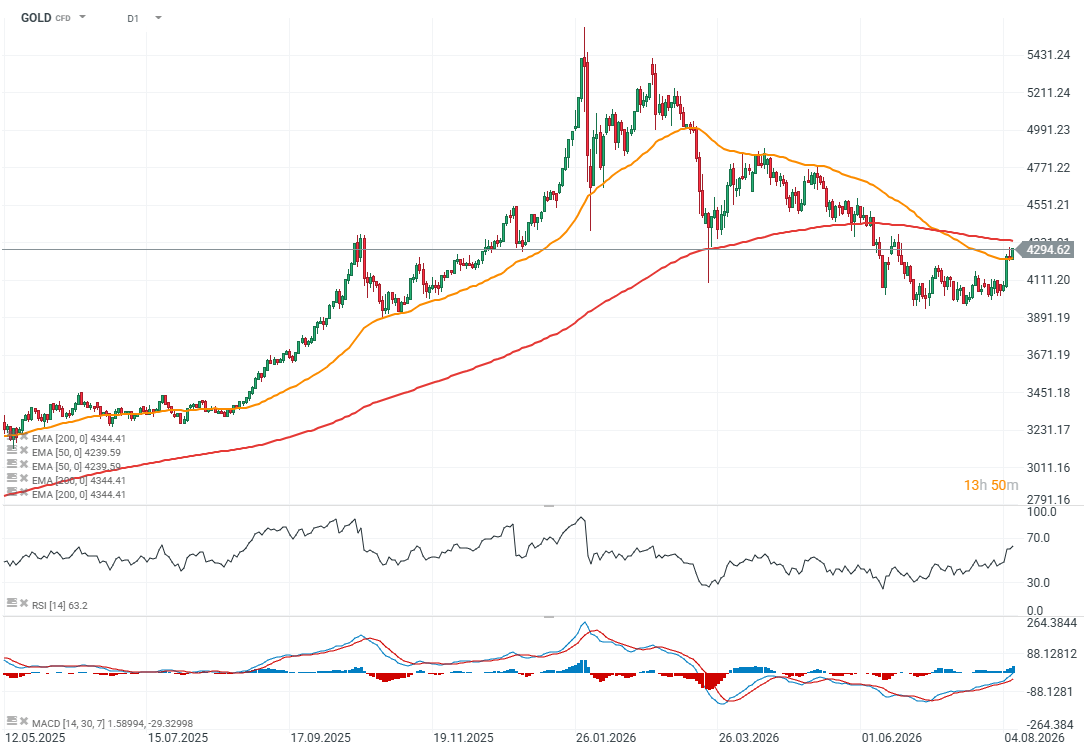
Source: xStation5



Market Wrap: A 4% surge in oil prices weighs on indices (08.10.2026)

EURUSD falls below 1.12 amid hawkish Fed's Waller remarks


Chart of the Day 📉 DE40 Falls 0.7% and Tests Key Support Amid Weak European Market Sentiment (October 8, 2026)

Economic Calendar: U.S. Jobless Claims and ECB Meeting Minutes in Focus (08.10.2026)
The content of this report has been created by XTB S.A., with its registered office in Warsaw, at Prosta 67, 00-838 Warsaw, Poland, (KRS number 0000217580) and supervised by Polish Supervision Authority ( No. DDM-M-4021-57-1/2005). This material is a marketing communication within the meaning of Art. 24 (3) of Directive 2014/65/EU of the European Parliament and of the Council of 15 May 2014 on markets in financial instruments and amending Directive 2002/92/EC and Directive 2011/61/EU (MiFID II). Marketing communication is not an investment recommendation or information recommending or suggesting an investment strategy within the meaning of Regulation (EU) No 596/2014 of the European Parliament and of the Council of 16 April 2014 on market abuse (market abuse regulation) and repealing Directive 2003/6/EC of the European Parliament and of the Council and Commission Directives 2003/124/EC, 2003/125/EC and 2004/72/EC and Commission Delegated Regulation (EU) 2016/958 of 9 March 2016 supplementing Regulation (EU) No 596/2014 of the European Parliament and of the Council with regard to regulatory technical standards for the technical arrangements for objective presentation of investment recommendations or other information recommending or suggesting an investment strategy and for disclosure of particular interests or indications of conflicts of interest or any other advice, including in the area of investment advisory, within the meaning of the Trading in Financial Instruments Act of 29 July 2005 (i.e. Journal of Laws 2019, item 875, as amended). The marketing communication is prepared with the highest diligence, objectivity, presents the facts known to the author on the date of preparation and is devoid of any evaluation elements. The marketing communication is prepared without considering the client’s needs, his individual financial situation and does not present any investment strategy in any way. The marketing communication does not constitute an offer of sale, offering, subscription, invitation to purchase, advertisement or promotion of any financial instruments. XTB S.A. is not liable for any client’s actions or omissions, in particular for the acquisition or disposal of financial instruments, undertaken on the basis of the information contained in this marketing communication. In the event that the marketing communication contains any information about any results regarding the financial instruments indicated therein, these do not constitute any guarantee or forecast regarding the future results.