



The current US earnings season continues to exceed even the most optimistic expectations. S&P 500 companies are now expected to deliver earnings growth of 47.4% year-over-year for the second quarter, up from roughly 23% expected at the end of June. If realized, this would mark the strongest quarterly earnings growth since Q4 2021, when profits surged by more than 91% year-over-year. Excluding Alphabet and Amazon, expected earnings growth for the S&P 500 would still stand at an impressive 28.8% year-over-year, the strongest reading in five years.
Most companies are not only beating Wall Street estimates but are also prompting analysts to raise profit forecasts for the broader S&P 500. According to FactSet data as of July 31, 86% of S&P 500 companies have reported earnings per share above expectations, while 77% exceeded revenue forecasts. Nine of the eleven sectors have seen upward earnings revisions thanks to stronger-than-expected results and higher EPS estimates.
Looking ahead to the third quarter, 34 companies have raised earnings guidance, while only 20 have issued negative outlooks. Meanwhile, the S&P 500 currently trades at a forward P/E ratio of 19.6, below its five-year average of 19.9 and only slightly above its 10-year average of 19.0. Considering improving corporate margins, the strong earnings backdrop, and the index trading at record highs, current valuations do not appear particularly stretched.
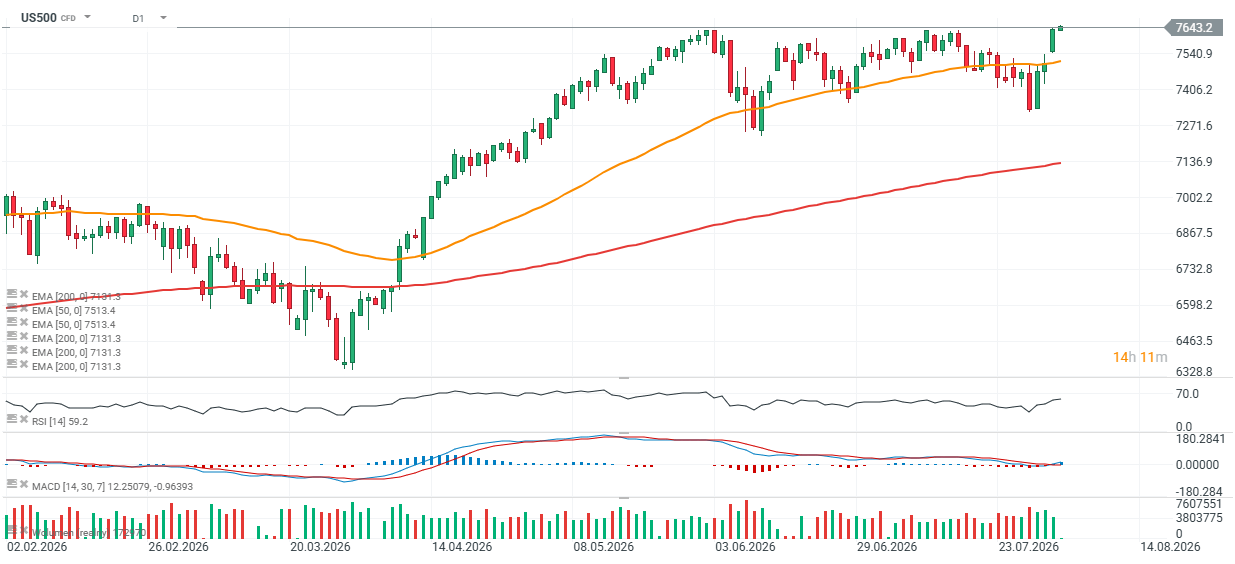
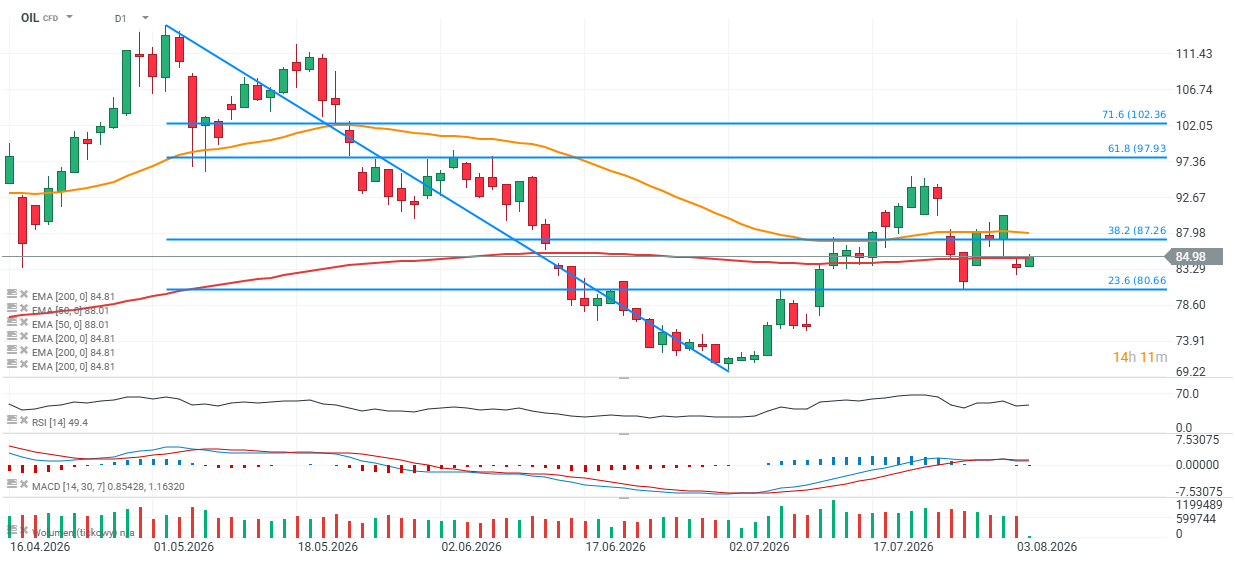
US500 and OIL charts (D1)
The US500 contract has recently rebounded twice after briefly falling below the 50-day EMA (orange line), highlighting the importance of the 7,200–7,300 point area as a key support zone for buyers. The index is now trading at an all-time high, while the RSI remains just below 60, suggesting there is still room for further upside. Key support levels are located near 7,500 and 7,300 points, where the market has previously seen significant buying interest.
Source: xStation5
Brent crude oil (OIL) has pulled back sharply from its recent local high near $94 per barrel and failed to break above the 61.8% Fibonacci retracement of the latest downward move. The next major support lies around $80 per barrel, defined by the 23.6% Fibonacci retracement and previous price reaction levels.
Source: xStation5



US OPEN: Trump de-escalates, OpenAI supports Wall Street sentiment

Nasdaq tries to recover losses 📈 Was the OpenAI revenue scare overdone?



Economic Calendar: Canada’s Jobs Report in Focus



Morning Wrap: OpenAI Revenue Concerns Weigh on Wall Street
The content of this report has been created by XTB S.A., with its registered office in Warsaw, at Prosta 67, 00-838 Warsaw, Poland, (KRS number 0000217580) and supervised by Polish Supervision Authority ( No. DDM-M-4021-57-1/2005). This material is a marketing communication within the meaning of Art. 24 (3) of Directive 2014/65/EU of the European Parliament and of the Council of 15 May 2014 on markets in financial instruments and amending Directive 2002/92/EC and Directive 2011/61/EU (MiFID II). Marketing communication is not an investment recommendation or information recommending or suggesting an investment strategy within the meaning of Regulation (EU) No 596/2014 of the European Parliament and of the Council of 16 April 2014 on market abuse (market abuse regulation) and repealing Directive 2003/6/EC of the European Parliament and of the Council and Commission Directives 2003/124/EC, 2003/125/EC and 2004/72/EC and Commission Delegated Regulation (EU) 2016/958 of 9 March 2016 supplementing Regulation (EU) No 596/2014 of the European Parliament and of the Council with regard to regulatory technical standards for the technical arrangements for objective presentation of investment recommendations or other information recommending or suggesting an investment strategy and for disclosure of particular interests or indications of conflicts of interest or any other advice, including in the area of investment advisory, within the meaning of the Trading in Financial Instruments Act of 29 July 2005 (i.e. Journal of Laws 2019, item 875, as amended). The marketing communication is prepared with the highest diligence, objectivity, presents the facts known to the author on the date of preparation and is devoid of any evaluation elements. The marketing communication is prepared without considering the client’s needs, his individual financial situation and does not present any investment strategy in any way. The marketing communication does not constitute an offer of sale, offering, subscription, invitation to purchase, advertisement or promotion of any financial instruments. XTB S.A. is not liable for any client’s actions or omissions, in particular for the acquisition or disposal of financial instruments, undertaken on the basis of the information contained in this marketing communication. In the event that the marketing communication contains any information about any results regarding the financial instruments indicated therein, these do not constitute any guarantee or forecast regarding the future results.